

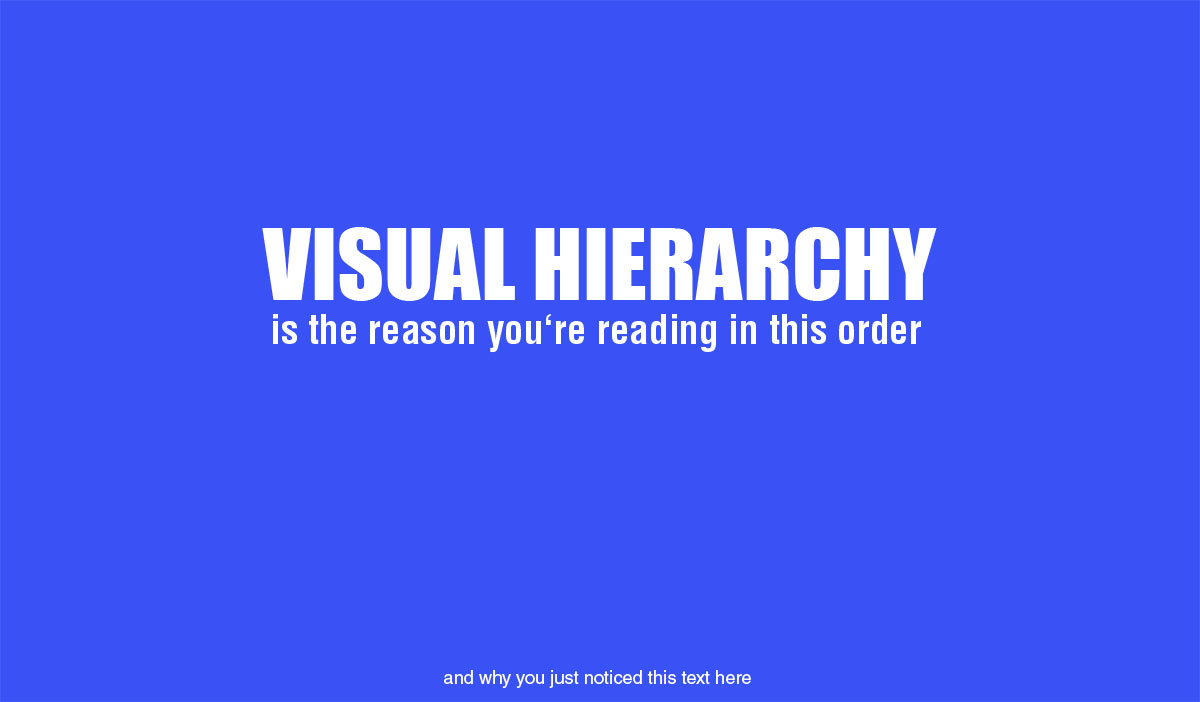
Users form an opinion about your page in about 50 milliseconds. That’s faster than a blink. And visual hierarchy is what determines whether that snap judgment works in your favor or sends someone reaching for the back button.
It’s the system behind every design decision that tells the eye where to go first, what to read next, and what action to take. Size, contrast, spacing, color, typography. These aren’t decorative choices. They’re ranking tools.
This guide breaks down how visual hierarchy actually works, from the cognitive science behind scanning patterns to the specific design principles that control user attention and drive conversions. Whether you’re building a landing page, a dashboard, or a product interface, this is the framework that makes content readable and actionable.
What Is Visual Hierarchy

Visual hierarchy is the arrangement of design elements in a way that signals their order of importance. It tells the viewer where to look first, what to read next, and what action to take.
The concept comes from Gestalt principles of perception, specifically how the human brain groups information and processes it as a whole rather than as isolated parts. Max Wertheimer and Wolfgang Köhler laid this groundwork in the 1920s, and it’s still the backbone of every layout decision made in design today.
It applies across web design, print, advertising, data visualization, and UI/UX. Every time you scan a landing page, read a magazine spread, or open a mobile app, visual hierarchy is doing the heavy lifting.
A study published in the Journal of the American Medical Informatics Association (2024) found that fewer than 50% of health-related websites displayed clear visual hierarchy. That’s a problem. Because when hierarchy breaks, users stop trusting what they see.
There’s an important distinction here. Visual hierarchy is not the same as layout or composition. Layout deals with where things sit on a page. Composition handles balance between elements. Hierarchy assigns rank. It answers the question: what matters most?
Visual Hierarchy vs. Visual Composition
People mix these up constantly.
Composition is about arranging elements so they feel balanced and cohesive. Hierarchy is about prioritizing those elements so certain ones demand attention before others.
| Concept | Focus | Goal |
|---|---|---|
| Visual Hierarchy | Order of importance | Guide attention sequentially |
| Visual Composition | Spatial relationships | Create visual balance |
| Page Layout | Structural placement | Organize content areas |
A page can have beautiful composition and still fail at hierarchy. I’ve seen portfolio sites where everything looks stunning but the viewer has zero idea what to do next. That’s composition without hierarchy.
Why Visual Hierarchy Controls User Behavior
Users don’t read. They scan.
Nielsen Norman Group research confirms that people scan web pages using F-patterns on text-heavy content and Z-patterns on visual pages. These scanning patterns are consistent across desktop and mobile.
Eye Tracking and Scanning Patterns
F-pattern behavior: first lines of text receive the most fixations, and attention drops sharply as users move down the page. The first few words on each line get significantly more eye time than words further to the right.
Users spend roughly 80% of their viewing time on content above the fold, according to eye-tracking data compiled by Captchify. That doesn’t mean below-the-fold content is worthless. It means your hierarchy above the fold has to be strong enough to pull people downward.
Nielsen Norman Group also identified a “layer-cake pattern” where users jump between headings and skip body text entirely. Your heading structure isn’t decoration. It’s the map people actually follow.
Cognitive Load and Decision Making
Cluttered designs with flat hierarchy cause what cognitive psychologists call decision paralysis. When everything fights for attention at the same level, the brain defaults to doing nothing.
Intechnic (2024) reports that good UX design can increase conversion rates by up to 400%. A lot of that comes down to reducing the number of decisions a user has to make on a single screen.
Spotify ran into this. After simplifying their menu and clarifying the visual priority of core actions, they saw 30% higher user engagement. Fewer choices, clearer hierarchy, better outcomes.
How Hierarchy Directly Affects Conversions
HubSpot data shows that A/B testing CTAs consistently improves conversion performance by around 28%. But the color or copy of the button only matters if the hierarchy makes that button the most visually dominant element in its section.
CXL research confirms this directly: the color of a CTA has little effect on its own. What matters is how color changes the visual hierarchy of the page and makes the call-to-action stand out.
Airbnb’s bookings jumped 10% when they grouped similar options using proximity and spacing, both core hierarchy tools.
The Core Principles of Visual Hierarchy

Six main tools create hierarchy. Every design uses some combination of them, whether the designer thinks about it consciously or not.
| Principle | How It Works | Strongest Use Case |
|---|---|---|
| Size & Scale | Larger elements grab attention first | Headlines, hero images |
| Contrast | High light-dark differences create focus | CTAs, key data points |
| Color | Bright or saturated hues draw the eye | Accent elements, alerts |
| White space | Isolation increases perceived importance | Premium branding, focal areas |
| Alignment | Position on page implies reading order | Navigation, content flow |
| Proximity | Grouped items are perceived as related | Forms, card layouts, menus |
How Size and Contrast Work Together
Size alone is the bluntest tool. A 44px heading will always beat a 12px footnote for attention. People naturally associate significance with scale and proportion.
But size without contrast falls flat. Took me a while to actually internalize this. A large heading in a light gray on a white background? Almost invisible despite being big. A smaller heading in black on white, surrounded by generous spacing? Way more powerful.
Netflix uses this combination well on their homepage. The headline “Unlimited movies, TV shows, and more” is large, but it’s the high-contrast white text against a dark background that makes it truly dominant. Size gives it rank. Contrast gives it pull.
The Role of Whitespace in Directing Attention
Most people think of negative space as “empty” space. It’s not. It’s active. It’s doing a job.
Apple’s product pages are the textbook example. Their devices float in massive fields of white. Nothing competes. The product becomes the only thing your eyes can land on.
Research from Loopex Digital (2026) shows that minimal, content-first layouts increase viewing time by roughly 59% compared to cluttered alternatives. And cluttered designs see bounce rates about 50% higher.
When you give an element room to breathe, you’re telling the viewer: this is worth your attention. When you cram everything together, you’re saying nothing is more important than anything else. At least in my experience, the second approach always loses.
Typography as a Visual Hierarchy System

Typography alone can build an entire hierarchy without relying on color, images, or icons. Size, weight, style, and spacing create a complete system of visual ranking.
Type Scale Ratios
The math matters here. A type scale isn’t random sizing. It follows a ratio that creates predictable, harmonious steps between heading levels.
Common ratios include the Minor Third (1.2) for subtle contrast, the Major Third (1.25) for moderate steps, and the Golden Ratio (1.618) for dramatic separation.
At a 16px base with a 1.25 ratio, your scale looks like this: body at 16px, H4 at 31px, H3 at 39px, H2 at 49px, H1 at 61px. Each step feels intentional. Your mileage may vary depending on the typeface you choose, since different fonts can appear significantly larger or smaller at the same pixel size.
Toptal’s 2024 design guidelines note that designers default to 12pt body text out of habit, but bumping that to 14 or 16 often improves readability. I always start at 16 and adjust from there.
Weight, Style, and Case as Differentiation Tools
Font weight is the second-strongest lever after size. Analysis of 1,000 websites shows that 94% of designers use larger font sizes for emphasis, and 82% combine size with heavier weights.
A few quick rules that work consistently:
- Bold or semibold for headings, regular or light for body text
- Uppercase sparingly (labels, navigation items, short category tags)
- Italic for supporting context, quotes, or secondary information
The trap is using too many weights. If your page has regular, medium, semibold, bold, and extrabold all competing, you’ve created a flat hierarchy with extra fonts loaded. Two to three weights per font family is usually enough.
Font Pairing and Hierarchy
Mixing a serif with a sans-serif is the easiest way to create contrast between heading and body levels. Toptal’s typography guidelines confirm that combining typefaces from different families works far more reliably than pairing two serifs or two sans-serifs.
The U.S. Web Design System pairs Source Sans Pro (body) with Merriweather (display), which gives a clean reading experience with clear level separation. Google’s Material Design system takes a different route with a single family (Roboto) differentiated purely by weight and size.
Line spacing matters more than most people realize. The WCAG recommends a line height of 1.4 to 1.6 times the font size. The U.S. Web Design System pushes this further, recommending five distinct line-height tokens depending on the content type. Short UI labels get tight spacing. Long-form reading gets loose spacing.
Color and Visual Hierarchy

Color is tricky. It’s the most emotionally charged hierarchy tool, but it’s also the easiest one to misuse.
How Color Signals Importance
Bright, saturated hues pull the eye faster than muted tones. That’s not opinion. It’s how color psychology works at a perceptual level. Reds signal urgency. Blues build trust. CTA conversion tests consistently show red outperforming green by around 21%, though context matters more than the specific color.
The real principle at work isn’t “red converts better.” It’s that the CTA color must break the page’s dominant palette. A red button on a red page does nothing. A red button on a blue and white page? That’s hierarchy.
Bing discovered this the hard way, then the right way. They tested hundreds of blue shades for their link color and eventually landed on one that increased annual revenue by $80 million. Not because blue is magical, but because the exact shade created the right visual separation from surrounding content.
Accent Colors and Call-to-Action Design
One accent color does the job. Two can work. Three is almost always too many.
When every section has its own accent, the hierarchy collapses. Nothing stands out because everything is trying to stand out. I’ve seen dashboards with five different button colors and wondered which one I was supposed to click first. The answer, apparently, was all of them.
Stripe’s website demonstrates this well. Their primary brand color (a deep purple-blue) appears only on primary CTAs and key interactive elements. Everything else sits in neutral tones. The accent color palette is tight, and the hierarchy is immediately clear.
Accessibility and Contrast Ratios
WCAG 2.1 requires a minimum contrast ratio of 4.5:1 for body text and 3:1 for large text. These aren’t just accessibility targets. They’re hierarchy tools.
WebAIM’s 2025 analysis found that 94.8% of homepages have detectable WCAG errors. Many of those are contrast failures that simultaneously break both accessibility and visual hierarchy.
Low contrast between a heading and its background doesn’t just hurt readability for people with vision impairments. It reduces that heading’s visual weight for everyone. If your H2 is light gray on white, it’s functionally invisible in the hierarchy, regardless of its size.
Visual Hierarchy in Web and UI Design

Web interfaces add a layer of complexity that static design doesn’t have. Users interact. They scroll, click, hover, and resize. Hierarchy has to hold up across all of those states.
Component Hierarchy in Design Systems
Google’s Material Design and Apple’s Human Interface Guidelines both define strict component hierarchies. Buttons, for example, come in three tiers:
- Primary: filled, high-contrast, one per screen section
- Secondary: outlined or toned down, supporting action
- Tertiary: text-only, lowest visual weight
This isn’t just aesthetic preference. Research by Emplifi shows 49% of consumers abandon brands because of poor user experience. When button hierarchy is unclear, users hesitate. Hesitation kills conversions.
Call-to-Action Placement and Priority
A case study cited by HubSpot found that switching from text-based CTAs to button CTAs increased click-through rates by 32%. Buttons outperform text links by 200% on mobile, according to Google data.
But placement matters as much as styling. Grow & Convert research found that welcome gates (CTAs appearing immediately on page entry) achieve estimated conversion rates of 10-25%. Sidebar CTAs typically convert at 0.5-1.5%.
The hierarchy principle at play is simple: dominant visual position plus high contrast equals more clicks. Put your primary CTA where the user’s eye naturally lands, make it the most visually prominent element in that zone, and give it enough surrounding spacing to breathe.
Mobile vs. Desktop Hierarchy
Desktop hierarchy doesn’t automatically work on mobile. Small screens need different priorities.
StatCounter (2025) shows mobile accounts for 57.5% of global traffic. Mobile-friendly sites see 40% higher conversions than non-responsive ones, according to Hostinger data. These numbers make mobile hierarchy a revenue issue, not a design preference.
Thumb zones matter. The bottom third of a mobile screen is the easiest area to reach with one hand. Placing primary actions there, like Spotify does with its play controls, creates hierarchy that works with the body, not against it.
Larger tap targets (at least 44x44pt, per Apple’s HIG) also serve hierarchy. Bigger buttons aren’t just easier to tap. They signal importance through size, reinforcing the same design principles that work at every other scale.
Visual Hierarchy in Data Visualization

Charts and dashboards follow the same hierarchy rules as any other design. The difference is that the stakes are higher. A misread chart can lead to a bad business decision.
Pre-Attentive Attributes and Why They Matter
Pre-attentive attributes are visual features the brain processes in under 250 milliseconds, before conscious thought kicks in. Color, size, position, and shape all qualify.
A 2025 PMC study on clinical dashboards found that physicians using pre-attentive cues detected critical patient changes 14 seconds faster and missed fewer events (11% vs. 19%) compared to standard monitors.
Colin Ware’s research categorizes four types: form (size, shape, orientation), color contrast, movement, and spatial position. Position on a 2D plane is the most effective for quantitative data. Color is the most powerful for drawing focus to a single data point.
Edward Tufte’s Data-Ink Ratio
The rule is simple: maximize the share of ink devoted to actual data. Gridlines, decorative borders, background fills, and redundant labels are all “chart junk” that competes with your data for visual attention.
Tufte’s book, The Visual Display of Quantitative Information, is still the benchmark. The core question he asks: “Would the data suffer any loss if this element were removed?” If the answer is no, cut it.
Tableau uses this principle by default, encouraging users to encode data through pre-attentive channels rather than decorative elements. The hierarchy goes: primary metric gets the strongest visual weight, supporting data stays muted.
Dashboard Hierarchy in Practice
| Layer | Content | Visual Treatment |
|---|---|---|
| Primary | Key metric or KPI | Largest size, highest contrast |
| Secondary | Supporting trends and charts | Medium size, neutral tones |
| Tertiary | Labels, axes, timestamps | Smallest, lowest visual weight |
Pre-attentive attributes become less effective as variety increases. A single red bar in a field of blue bars grabs instant attention. Five different colors in the same chart? Your viewer has to consciously scan each one, which defeats the purpose.
How to Test Visual Hierarchy

You can’t just eyeball your own work and declare the hierarchy “good.” You’re too close to it. Every method below catches problems you’ll miss on your own.
The Squint Test and Blur Test
Luke Wroblewski popularized the squint test: partially close your eyes and look at your design. Fine details disappear, and only the largest shapes, highest-contrast areas, and dominant colors remain visible.
Questions to answer while squinting:
- Is the primary call to action still recognizable?
- Do related elements still look grouped?
- Which element grabs attention first, and should it?
Polypane offers a digital version through its far-sightedness emulation tool, so you don’t literally have to squint at your monitor all day.
Heatmaps and Eye-Tracking Tools
EyeQuant’s predictive models achieve roughly 90% accuracy compared to physical eye-tracking studies with dozens of participants, according to their validation data with the University of Osnabrück.
Groupon used EyeQuant to discover that imagery was overpowering their value proposition and CTA buttons. After redesigning around the hierarchy insights, they saw a 52% increase in landing page conversions.
Hotjar and Crazy Egg offer click heatmaps and scroll maps that show where users actually interact, complementing attention predictions with behavioral data.
A/B Testing Hierarchy Variations
HubSpot reports that marketers who consistently A/B test their designs see about a 28% lift in conversion performance. Test one hierarchy variable at a time: button prominence, headline size, section order, or content density.
Clay’s 2026 design guide puts it directly: A/B testing removes guesswork and turns design decisions into measurable outcomes. Pair it with heatmap data and you have a closed feedback loop.
Common Visual Hierarchy Mistakes
EyeQuant tested the top e-commerce sites in the US for visual hierarchy effectiveness. A staggering 70% failed. Prices and CTAs were getting buried behind product imagery and competing visual elements.
Everything Is Bold, So Nothing Stands Out
This is the most common mistake I see. Three competing headings at the same size. Five accent colors on one page. Bold text everywhere.
The fix is subtractive, not additive. Start by reducing visual weight on secondary elements instead of adding more weight to primary ones. When you lower the volume on everything else, your main message gets louder without changing a thing about it.
Competing Focal Points
Flat hierarchy kills scanning. When a hero image, a sidebar promotion, and a floating banner all fight for attention at the same level, users split their focus and process nothing fully.
Assign every element a tier: primary, secondary, or tertiary. One focal point per screen section. That’s it. Two maximum, and only if they’re spatially separated enough to not compete.
Ignoring Mobile Hierarchy
A three-column desktop layout that collapses into a single column on mobile creates an entirely different reading order. Elements that sat side-by-side now stack vertically, which changes what comes first.
Test hierarchy on mobile separately from desktop. The heading sizes, button placements, and content order that work on a 1440px screen rarely translate directly to a 375px viewport.
Over-Reliance on Color Alone
About 8% of men and 0.5% of women have some form of color vision deficiency. If color is your only hierarchy signal, a meaningful portion of your audience sees a flat design.
Layer your signals. Use size and color. Use position and weight. If you removed all color from your design and the hierarchy still reads clearly, you’ve built it on solid ground.
Visual Hierarchy Examples and Breakdowns

Theory is useful. Seeing it applied is better. Below are real-world examples of visual hierarchy done well, across different design contexts.
Apple Product Pages
Apple’s approach is minimalist to its core. One product image dominates the viewport. One headline. One supporting line. One CTA. Everything else is stripped away.
The hierarchy is unmistakable: product first, message second, action third. They use massive type scale differences (often 60px+ headlines against 16px body) and acres of baseline-level spacing to make sure nothing competes.
News Websites (NYT, BBC)
| Hierarchy Level | NYT Treatment | BBC Treatment |
|---|---|---|
| Lead story | Large image + bold headline | Featured card with image |
| Secondary stories | Smaller headlines, no images | Thumbnail + text list |
| Tertiary content | Text-only links in sidebar | Compact grid, muted tones |
Both sites use typographic hierarchy as their primary tool. The NYT leans heavily on font weight and size differences. The BBC uses grid systems and spatial separation to rank content importance.
SaaS Landing Pages (Stripe, Linear)
Stripe’s homepage follows a predictable but effective pattern: oversized headline, one-sentence value proposition, primary CTA in a high-contrast button, then a product screenshot that supports the claim.
Linear takes a darker approach but uses the same design elements. Their hierarchy is built almost entirely through color harmony and type scale. Primary actions glow. Secondary content recedes into darker tones. The visual flow is clear without any framing tricks or complex rhythm patterns.
Print References and Poster Design
National Geographic covers are a masterclass. The photograph takes up the full frame (visual dominance through size). The logo sits at a consistent position (brand repetition). Headlines use tight kerning and bold weight to cut through complex imagery.
Swiss design from the mid-20th century actually codified many of the hierarchy principles still used today. Designers like Josef Müller-Brockmann built entire systems around unity, strict grids, and clear type hierarchies. The Bauhaus movement before them laid the groundwork, treating typographic structure as a functional tool rather than decoration.
FAQ on Visual Hierarchy
What is visual hierarchy in design?
Visual hierarchy is the arrangement of elements to show their order of importance. It uses size, color, contrast, spacing, and typography to guide where the eye looks first, second, and third on any page or screen.
Why does visual hierarchy matter for websites?
Without clear hierarchy, users can’t tell what’s important. They leave. Sites with strong visual hierarchy see up to 40% higher engagement because visitors can scan content, find what they need, and take action without friction.
What are the main principles of visual hierarchy?
Six core principles drive it: size and scale, color saturation, contrast, spacing, alignment, and proximity. Each one controls how much visual weight an element carries relative to everything else on the page.
How do F-pattern and Z-pattern scanning work?
The F-pattern applies to text-heavy pages. Users scan horizontally across the top, then down the left side. The Z-pattern works on visual pages, moving top-left to top-right, then diagonally to bottom-left and across again.
How does typography create visual hierarchy?
Type scale ratios, font weight, and letter spacing all assign rank to text. A bold 48px heading dominates a 16px paragraph. Two to three weight variations within a single font family is usually enough.
What role does color play in visual hierarchy?
Color draws attention through hue and saturation differences. A bright accent against neutral tones creates instant focus. The key is limiting accent colors so one element clearly dominates rather than several competing equally.
What is the squint test for visual hierarchy?
Partially close your eyes and look at your design. Details vanish. Only dominant shapes, high-contrast areas, and primary colors remain. If your most important element doesn’t stand out in this blurred view, your hierarchy needs work.
How does white space affect visual hierarchy?
Negative space isolates elements and increases their perceived importance. Crowded layouts signal that nothing is more significant than anything else. Generous spacing around a headline or CTA tells the viewer: this is what matters most.
What are common visual hierarchy mistakes?
The biggest one is making everything bold, which flattens the hierarchy entirely. Other frequent problems include too many accent colors, competing display fonts, inconsistent heading sizes, and ignoring how desktop layouts reorder on mobile screens.
How do you test if your visual hierarchy works?
Use the squint test for quick checks. Run heatmap tools like Hotjar or predictive platforms like EyeQuant for data-backed validation. Then A/B test specific variables (button size, headline scale, section order) to measure actual conversion impact.
Conclusion
Visual hierarchy isn’t a nice-to-have. It’s the structural foundation that determines whether users engage with your content or bounce within seconds.
Every principle covered here, from Gestalt-based grouping to type scale ratios to pre-attentive attributes in data visualization, serves one function: controlling where attention goes and in what order.
The tools are accessible. Run a squint test. Check your contrast ratios against WCAG standards. Use heatmap data from Hotjar or predictive attention maps from EyeQuant. A/B test your CTA placement and heading sizes.
Good hierarchy is subtractive. Remove competing signals until one clear path remains. Assign every element a tier. Test on mobile separately.
Start with your most important page. Apply one principle at a time. Measure the difference. The data will tell you what’s working and what still needs to change.

Renowned for his expertise in logo design and visual branding, Bogdan has developed a multitude of logos for various clients.
His skills extend to creating posters, vector illustrations, business cards, and brochures. Additionally, Bogdan's UI kits were featured on marketplaces like Visual Hierarchy and UI8.
He also wrote in the past years on sites like Design Your Way, WebDesignerDepot, WPDean, Designmodo, Speckyboy, Slider Revolution, and more.
- Baseball Team Color Codes - 28 July 2026
- How Creators Can Use AI Image Tools to Make Better Visual Content - 28 July 2026
- Canva vs Adobe Express: Which Is Better? - 27 July 2026

Bogdan Sandu is a seasoned designer who has been designing websites since 2008. Renowned for his expertise in logo design and visual branding, Bogdan has developed a multitude of logos for various clients. His skills extend to creating posters, vector illustrations, business cards, and brochures. Additionally, Bogdan's UI kits were featured on marketplaces like Visual Hierarchy and UI8. He also wrote in the past years on sites like Design Your Way, WebDesignerDepot, WPDean, Designmodo, Speckyboy, Slider Revolution, and more.
You Might Also Like


