


Most people weighing these two jobs already know they want to work on digital products. What’s harder to figure out is whether they’d rather watch users or count them.
UX designers work on the interface itself. That means layouts and flows, plus the usability tests that show whether any of it works. Data analysts study the same users through statistical analysis and data visualization, and many of them never sit in on a single test session. At most tech companies, both roles report into the same product organization and work on the same research problem from different directions.
The design side is a bigger field than people assume. The U.S. Bureau of Labor Statistics counted 214,900 people in the combined web developer and digital designer category, which includes UX design work, as of 2024.
UX Designer vs Data Analyst: What Is the Core Difference?
A designer’s day usually starts in Figma. An analyst’s starts with a query, and often with a dataset that has to be cleaned before anyone can trust it.
Put more plainly, one person decides how a product feels to use. The other explains why people behave the way they do once they’re inside it.
| Attribute | UX Designer | Data Analyst |
|---|---|---|
| Focus | Interface, flow, usability | Numbers, patterns, reporting |
| Core tool | Figma | SQL |
| Typical degree | Design, HCI, psychology | Statistics, computer science |
| 2024 median pay (BLS) | $98,090 | $91,290 |
For the formal definition, UX design covers how a person experiences a product from the first tap to the last.
People mix it up with a neighboring role all the time. It’s the same confusion you see around the difference between a UI designer and a UX designer.
The two roles also make decisions differently. Designers watch people, try to understand what they’re feeling, and iterate until something works. Analysts want a hypothesis they can measure, and they won’t call it a finding until the numbers hold up statistically.
Spotify runs both functions inside the same product organization. Its designers and analysts review the same feature, each working from a different kind of evidence.
The design half has a business case you can measure. According to McKinsey’s Business Value of Design research, companies in the top quartile for design practice grew revenue 32 percentage points faster than their industry peers over a five-year period.
What Does a UX Designer Do?

Most of the day goes into turning a vague product goal into something a real person can use without getting stuck.
In a normal week, that includes:
- Sketching wireframes for a new screen or feature
- Running usability testing sessions with real users
- Building interactive prototypes so stakeholders can click through them
- Debating one button label for twenty minutes in a design critique (this happens more than anyone admits)
- Mapping the user journey across a checkout or onboarding flow
Most UX designers sit on a product team with engineers and a product manager. Agencies and in-house design departments organize the role a little differently.
Much of the work comes down to getting the eye to land on the right element first. That’s visual hierarchy, and it’s one of the most heavily tested ideas in the field.
Duolingo’s design team is known for testing dozens of onboarding variations before a new screen goes out to everyone.
From the outside the job looks creative. In practice it’s mostly repeated, disciplined testing, with some creative work mixed in.
What Does a Data Analyst Do?
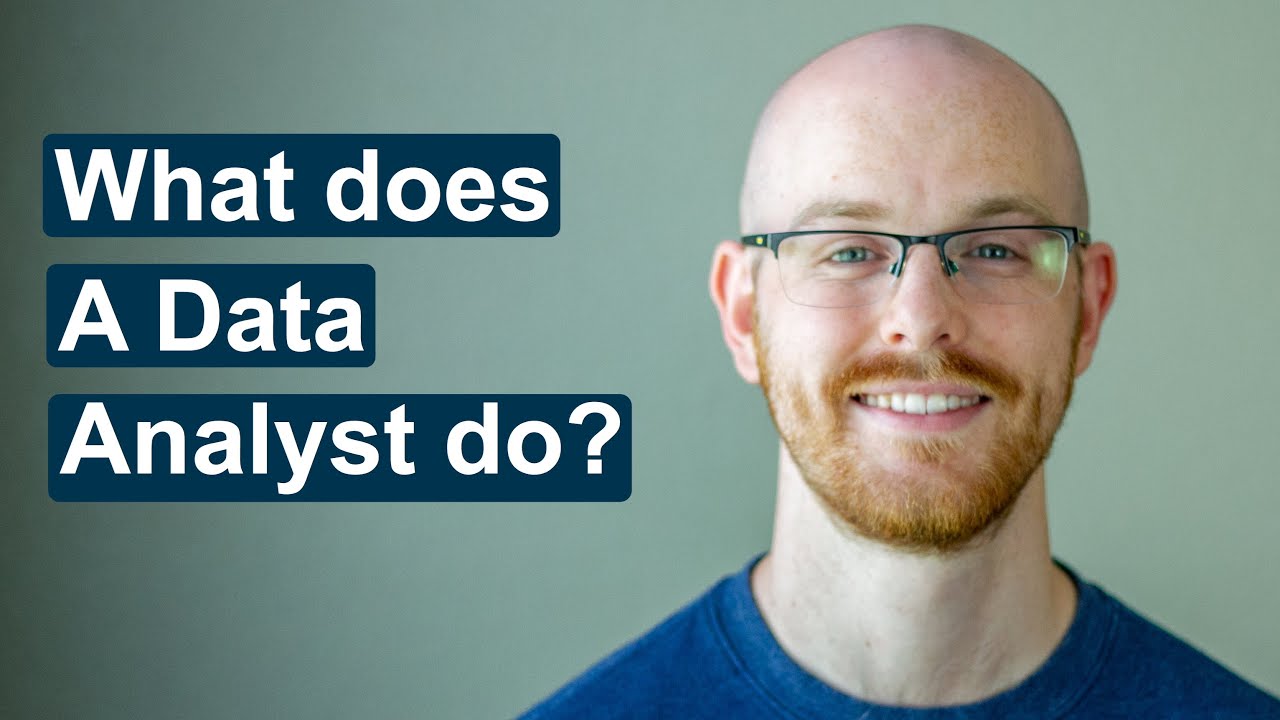
The job is taking raw numbers and putting them in a form someone else can act on.
- Cleaning messy data until it can be trusted
- Writing SQL queries against a production database
- Building dashboards for the weekly business review
- Running exploratory data analysis to look for a pattern worth reporting
- Presenting findings to a stakeholder who only wants the short version
Analysts usually sit on a business intelligence team. Some are embedded directly in marketing, product, or finance.
Netflix’s analytics teams are a well known example. Their viewing data shapes what shows up on each user’s homepage.
A UX designer asks how something feels. The analyst checks whether the numbers support that feeling, and sometimes they don’t.
Companies like Inoxoft understand the critical role data analysts play in today’s digital economy and offer tailored data solutions to help organizations turn raw data into actionable insights. Their support empowers analysts to work smarter with the right tools and frameworks in place.
Core Skills Compared

On paper, the two skill sets barely overlap. That’s true even when both people end up in the same meeting every Tuesday.
Skills Unique to UX Design
- Interaction design and prototyping
- Running a usability test without leading the participant, which is harder than it sounds
- Translating research findings into a wireframe
- Knowing when a flow is “done enough” to test
Good interface work also depends on typography. Most users never consciously notice it, but they feel it anyway.
Skills Unique to Data Analysis
SQL comes first. It’s the baseline for getting data out of a database, and it’s hard to get hired without it.
After that comes statistical analysis, which mostly means knowing when a pattern is real and when it’s noise. The other skill that separates good analysts is data storytelling, meaning turning a chart into a decision someone will actually make.
None of these transfer directly to a design role. That’s expected, since the two jobs do different things.
Skills Both Roles Share
Both jobs depend on explaining findings to people who weren’t there for the research.
Stakeholder communication and hypothesis framing show up in both job descriptions, often word for word. Presentation skills matter in both too, though designers tend to present more often.
Tools and Software Compared
If a designer and an analyst swapped software for a week, neither would get anything done.
UX Design Tools
Figma dominates here. It holds roughly 82% of the UI design tool market, and close to nine in ten designers name it as their primary tool, according to UX Tools’ most recent Design Tools Survey.
- Figma for interface design and prototyping
- Sketch and Adobe XD, still used in older workflows
- Maze and Hotjar for usability testing and heatmaps
- Miro for research synthesis and journey mapping
Some designers keep a UI design cheat sheet open in a side tab while they switch between several of these tools in one afternoon.
Beginners sometimes start with something simpler before moving to Figma. That’s why the practical difference between Canva vs Figma comes up so often in entry level forums.
Data Analysis Tools
- SQL for querying structured data
- Python and R for statistical modeling
- Tableau and Power BI for dashboards
- Excel, which is still everywhere despite everything else on this list
- Snowflake and Looker, mostly on larger, more mature data teams
Nobody on a data team opens Figma to check a number.
Education and Entry Path Compared

You can get into either role without a directly matching degree. The routes in are very different, though.
Path Into UX Design
Degrees in design, human-computer interaction, or psychology are common, and so are bootcamps through providers like General Assembly.
What usually decides a hire is the portfolio. Recruiters expect 3 to 5 case studies, and a strong one will outweigh a degree.
A full walkthrough of how to become a UX designer covers the portfolio requirement in more depth than a job posting ever will.
Some candidates also add a UX design certification when their resume is light on formal design education.
Path Into Data Analysis
This path depends more on quantitative coursework. Statistics, computer science, and economics degrees are the usual background, and certification programs on platforms like Coursera fill the gap for people who don’t have one.
Instead of design mockups, applicants show a GitHub repo or portfolio site with SQL and Python work.
A design portfolio does almost nothing for a data analyst application. Taking a messy spreadsheet and turning it into a clean, correct dashboard does a lot.
Salary Comparison
Pay for the two roles is close enough that money alone rarely decides it.
UX designers earn a median of $98,090 per year nationally. BLS files them under web and digital interface designers (U.S. Bureau of Labor Statistics, 2024).
Data analysts are harder to pin down because there’s no single official code for “data analyst.” The closest BLS category is operations research analysts, with a median of $91,290 per year nationally (U.S. Bureau of Labor Statistics, 2024).
Growth is where the two diverge. UX-adjacent jobs are projected to grow 7% from 2024 to 2034, which is much faster than average (U.S. Bureau of Labor Statistics). Data analyst jobs are projected to grow 21% over the same period (U.S. Bureau of Labor Statistics).
So UX pays slightly more today, but the data side is expected to add jobs at roughly three times the rate over the next decade.
Both figures swing a lot with location, industry, and seniority. Treat a national median as a starting point, not a promise.
Career Growth Compared

The title ladders look similar. The pace of movement up them is different.
| Stage | UX Designer Track | Data Analyst Track |
|---|---|---|
| Entry | Junior or associate designer | Junior data analyst |
| Mid | UX designer, senior UX designer | Senior data analyst |
| Senior | Lead designer, principal designer | Analytics manager |
| Leadership | Head of design | Director of analytics |
IBM’s design organization publishes one of the more detailed public career ladders in the industry, running from junior designer up to distinguished designer.
On the data side, Airbnb’s internal data science program is often cited for formalizing an analyst-to-manager path, and other companies have since copied it.
The ladders split at the senior level. Designers often choose between people management and a “principal” individual-contributor track with no direct reports. Analysts are more likely to move into analytics engineering, or leave data for general management altogether.
How UX Designers and Data Analysts Work Together

They usually meet over a research finding that neither of them can act on alone.
A typical case is an analyst spotting a drop-off point in a signup flow. The designer redesigns the screen that’s causing it. After the change ships, they both look at the new numbers together.
This collaboration is harder than it sounds. An international survey of 279 UX practitioners found collaborative data analysis to be a real pain point, with most respondents struggling with time pressure and with merging findings from multiple collaborators (Kuang, Jin, and Fan, 2022).
Booking.com is known in the industry for large-scale interface testing, where analysts and designers review results together before any change goes out to all users.
The friction is real. In my view it’s also useful, because products built this way tend to be better than what either role produces alone.
Which Career Path Fits You?

Neither path is better overall. They suit different temperaments.
If You’re Leaning Toward UX
It suits people who would rather sketch ten versions of a screen than run the same query twice. Ambiguous, open-ended problems should give you energy, not wear you out. It also helps if you like having your work visible, and argued over, in a room full of stakeholders.
The downsides are real. Feedback is often subjective and can feel personal. Design decisions also get overruled by the loudest opinion in the room far more often than data does.
If You’re Leaning Toward Data
- You want your conclusions backed by numbers, not opinions
- Problems with a clear right answer feel satisfying rather than limiting
And you’d take writing one clean query over sitting through a two-hour design critique.
The biggest downside is that good analysis goes unnoticed. Credit often goes to whoever presents the dashboard, not the person who built it.
If what you want is to build whole pages end to end rather than individual interactions, you may really be weighing a web designer and a UX designer, not UX against data.
Can You Switch Between UX Design and Data Analytics?
You can switch in either direction. Neither is quick.
Plenty of people are thinking about it, though. Heading into 2024, 46% of professionals said they were considering quitting their jobs, according to Microsoft and LinkedIn’s Work Trend Index.
UX Designer to Data Analyst
- Learn SQL and basic statistics before anything else
- Build 2 to 3 analysis projects using real, messy public datasets
- Rewrite your design research experience on your resume in the language of hypothesis testing
- Apply to hybrid titles like product analyst first, before pure data analyst roles
Data Analyst to UX Design
This direction usually takes longer because what you deliver changes completely.
- Learn a design tool and complete a short UX course or certification
- Rebuild 2 to 3 real problems as full case studies, not just visuals
- Describe your past data work as “research” in interviews, because it is research
Interview prep matters more here than most people expect. A list of common UX designer interview questions shows how much of the interview is about walking through your process, not just showing final screens.
The same goes for your resume. A UX designer resume built around case study links usually does much better than one that only lists tools and job titles.
When Neither Role Is the Right Fit

Sometimes a person doesn’t want either job, and forcing it can cost them a year.
Signs UX Design Is the Wrong Fit
You want to focus only on visual craft and have little interest in user research or usability testing. Or you hate defending your decisions in front of a room, which is a big part of the job.
Signs Data Analysis Is the Wrong Fit
- You want to build models, not report on numbers someone else already collected
- Repetitive querying and cleaning feels tedious rather than satisfying
The job market is also drawing this line more clearly than it used to.
The World Economic Forum’s Future of Jobs Report 2025 lists UI and UX designers among the top 15 fastest growing roles worldwide through 2030. That’s more optimistic than the roughly 7% domestic growth the U.S. Bureau of Labor Statistics projects for the same work.
The same WEF report lists graphic designers among the fastest declining roles over that period. “Design” no longer describes a single job market.
If you want purely visual work without research or interaction design, look at the difference between a graphic designer and a UX designer before you rule out design entirely.
Neither job suits someone who wants no ambiguity and no unsolved problems. No role in tech offers that, whatever the title.
FAQ on UX Designer vs Data Analyst
Is UX Design a Subset of Data Analysis?
No. They’re separate disciplines that only overlap where research feeds into a product decision.
A UX designer works with usability testing and wireframes, and a data analyst works with SQL and statistical analysis. Neither role reports into the other.
Do UX Designers Need to Know SQL or Coding?
Most job postings don’t require it. Still, basic SQL lets a designer pull usage data without waiting on an analyst.
HTML and CSS literacy tends to matter more, since many designers hand specs straight into a design system.
Do Data Analysts Need Design Skills?
It’s rarely a hiring requirement. Good data visualization judgment, like picking the right chart in Tableau or Power BI, helps an analyst much more than interface design does.
Typography and visual hierarchy stay on the UX side of the job description.
Which Role Is Easier to Break Into With No Experience?
Usually data. Entry level analyst roles often accept a bootcamp certificate and a few SQL projects.
UX design usually requires a full case study portfolio, which takes longer to put together than a working dashboard or query sample.
What Goes Into a UX Portfolio vs a Data Analyst Work Sample?
For UX, expect wireframes, prototypes, and the reasoning behind each design decision, spread across 3 to 5 case studies.
An analyst’s sample is usually a public dashboard, a cleaned dataset, or annotated SQL queries showing real analysis.
What Mistakes Do People Make When Switching Between the Two Careers?
The most common one is leading with tool names. Interviewers are really probing for hypothesis framing or design reasoning.
The second mistake recruiters flag, in both directions, is collecting certificates without shipping a real project.
What Happens to the UX Designer vs Data Analyst Pay Gap Over Time?
Today, design pays $6,800 more at the national median. Data analytics is positioned to close that gap through hiring volume rather than higher salaries.
Using the federal projections cited above, data analyst roles are expected to grow three times faster than UX-adjacent design work through 2034.
If both projections hold, analytics headcount catches up to design well before the salary tables change, because job growth and median pay move on different timelines.
That depends on both projections actually happening. A hiring slowdown in either field over the next decade would undo the comparison, leaving today’s numbers as the only reliable snapshot.
If you’re deciding on numbers alone, a dedicated look at UX design statistics will tell you more than salary figures on their own.

Renowned for his expertise in logo design and visual branding, Bogdan has developed a multitude of logos for various clients.
His skills extend to creating posters, vector illustrations, business cards, and brochures. Additionally, Bogdan's UI kits were featured on marketplaces like Visual Hierarchy and UI8.
He also wrote in the past years on sites like Design Your Way, WebDesignerDepot, WPDean, Designmodo, Speckyboy, Slider Revolution, and more.
- The Windsurf Logo History, Colors, Font, And Meaning - 10 October 2026
- How to Remove Background From Product Photos (No Photoshop) - 10 October 2026
- How Designers can Build a Stronger Online Creative Identity - 9 October 2026

Bogdan Sandu is a seasoned designer who has been designing websites since 2008. Renowned for his expertise in logo design and visual branding, Bogdan has developed a multitude of logos for various clients. His skills extend to creating posters, vector illustrations, business cards, and brochures. Additionally, Bogdan's UI kits were featured on marketplaces like Visual Hierarchy and UI8. He also wrote in the past years on sites like Design Your Way, WebDesignerDepot, WPDean, Designmodo, Speckyboy, Slider Revolution, and more.
You Might Also Like


