Ever gaze at a mosaic of colors and shapes that tell a story more vividly than a thousand words? That’s the power of cool infographics. They transform snooze-fest data into visual feasts that snag your attention and stick in your memory.
We’re not just painting pretty pictures. We’re crafting narratives, scuba diving into oceans of information, and surfacing with treasures of knowledge made simple, made captivating. What I’ve got lined up for you is a toolkit, a DIY manual to sculpt infographics that sizzle with clarity and sophistication.
By the wrap of this scroll, you’ll have unlocked the secrets of data visualization tools and know how to wield design principles with the flair of a pro. Get set to unleash visually appealing charts and wake up the world with engaging infographics that make viewers pause, click, and share.
Prepare to stir curiosity with every pixel and every stat as we distill complex diagrams and breathe life into visual data analysis. This isn’t your everyday, run-of-the-mill info dump. It’s the blueprint to visual storytelling that sticks. Let’s dive in!
Awesome infographics to see
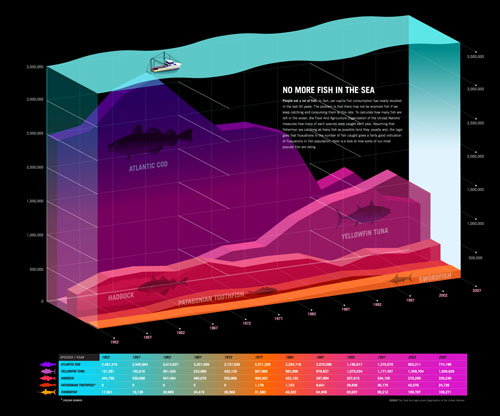
No more fish in the sea
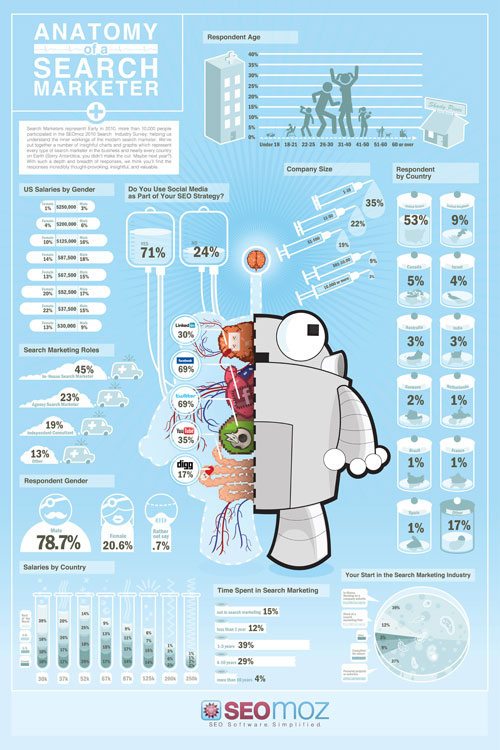
SEO Industry Survey Results
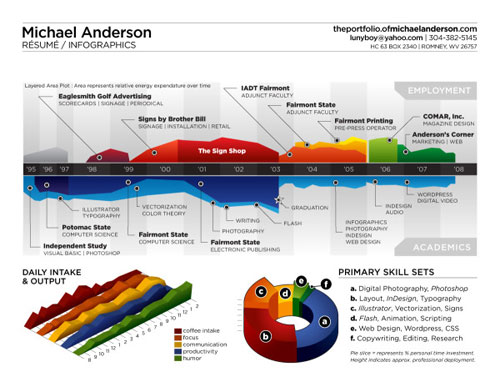
Michael Anderson Resume
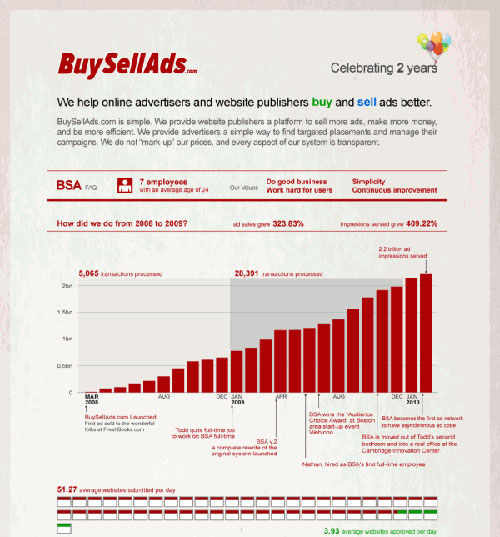
BuySellAds Infographic
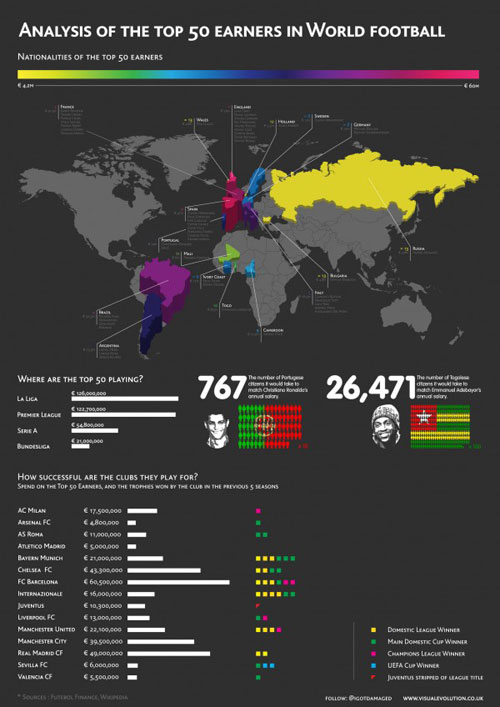
Top World Football Earners Infographic
Underskin: The Human Subway Map

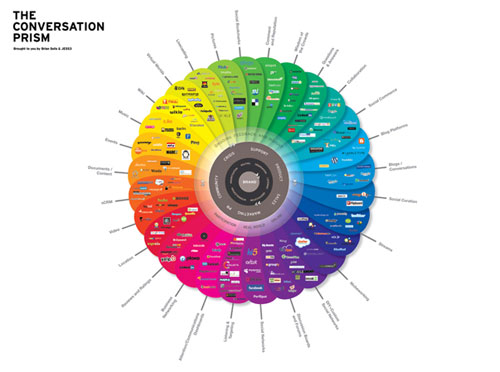
The conversation prism
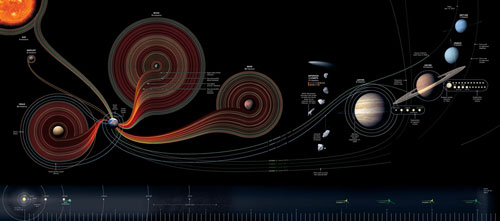
50 Years of Space Exploration
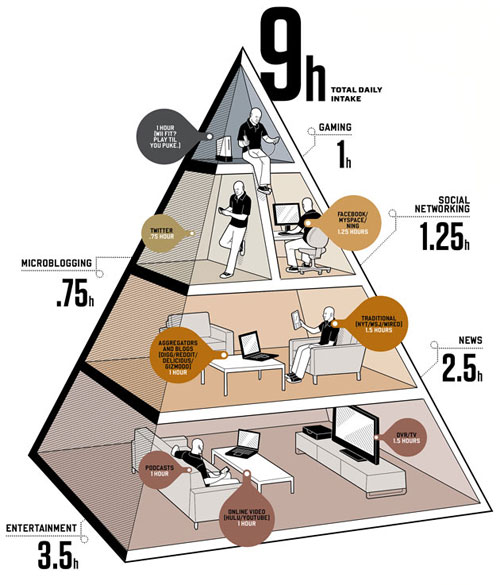
Balance Your Media Diet
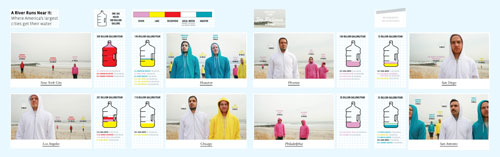
Where America’s largest cities get their water
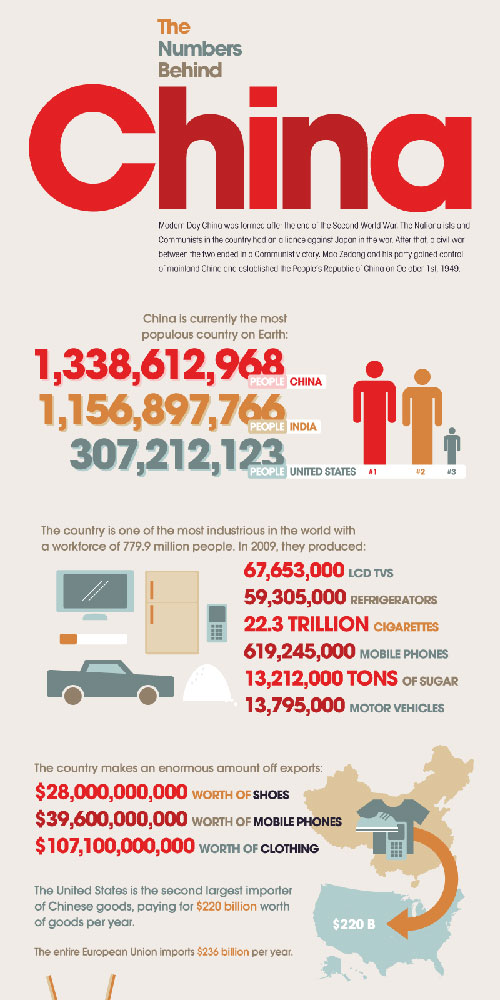
The Numbers Behind China
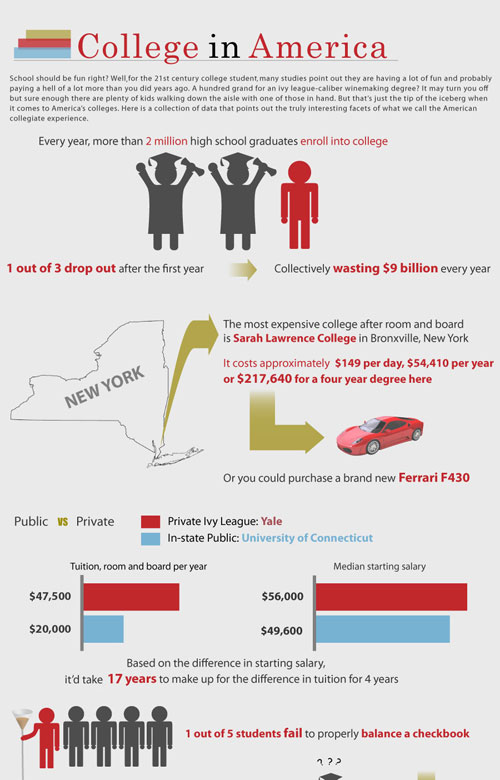
College in America
Why Do Freeways Come to a Stop?

The Internet’s undersea world

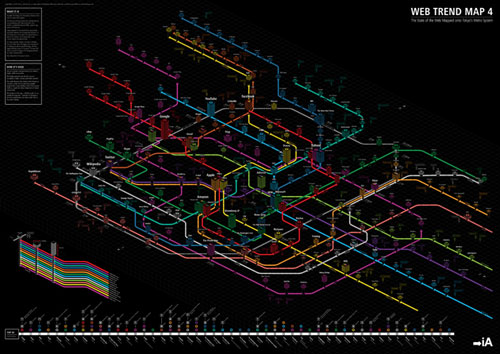
Web Trend Map 4
Looking for a research opportunity
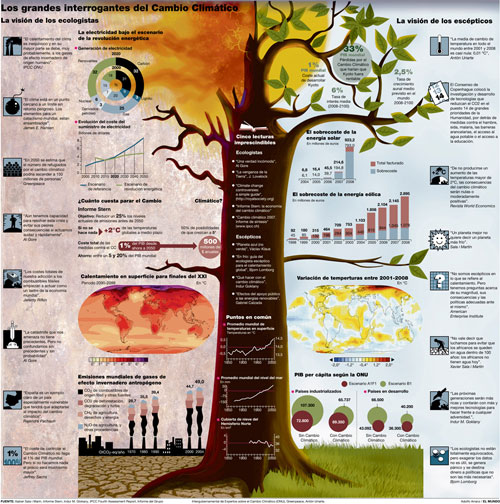
Los grandes interrogantes del Cambio Climático
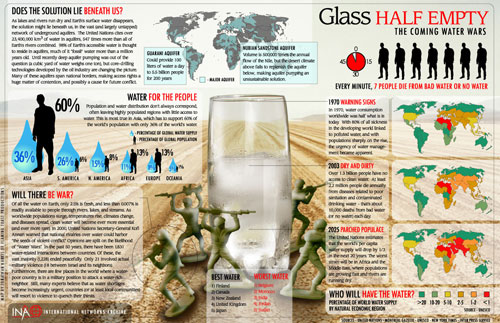
Water problem
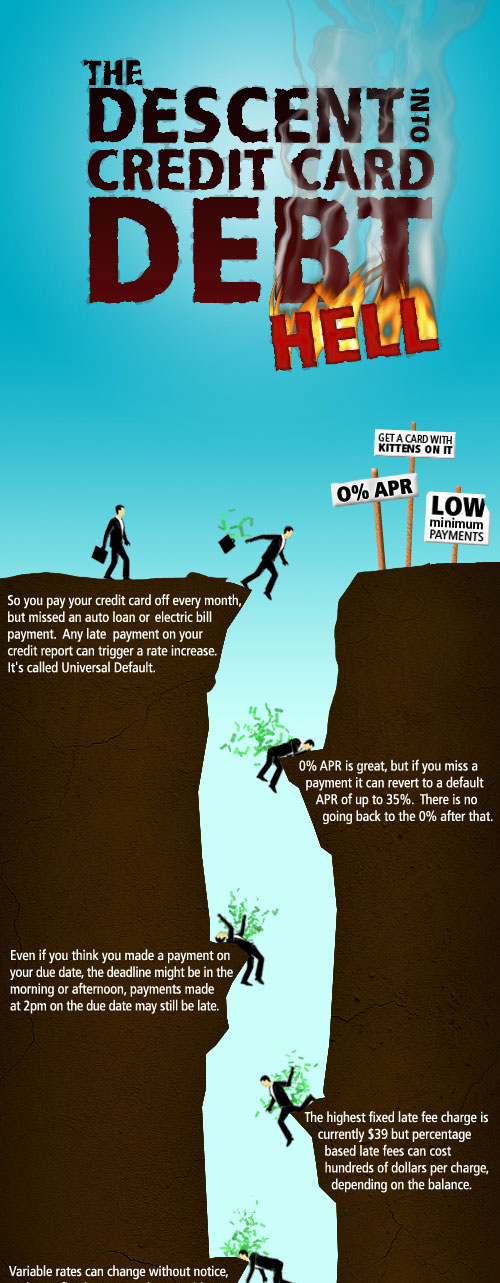
The Descent into Credit Card Debt
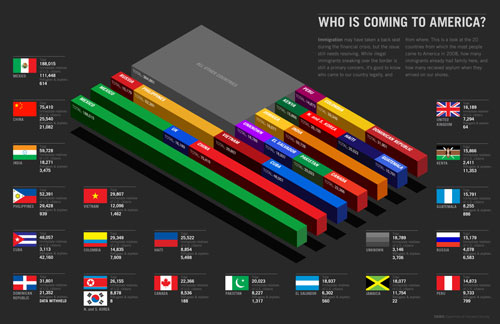
Who is coming to America
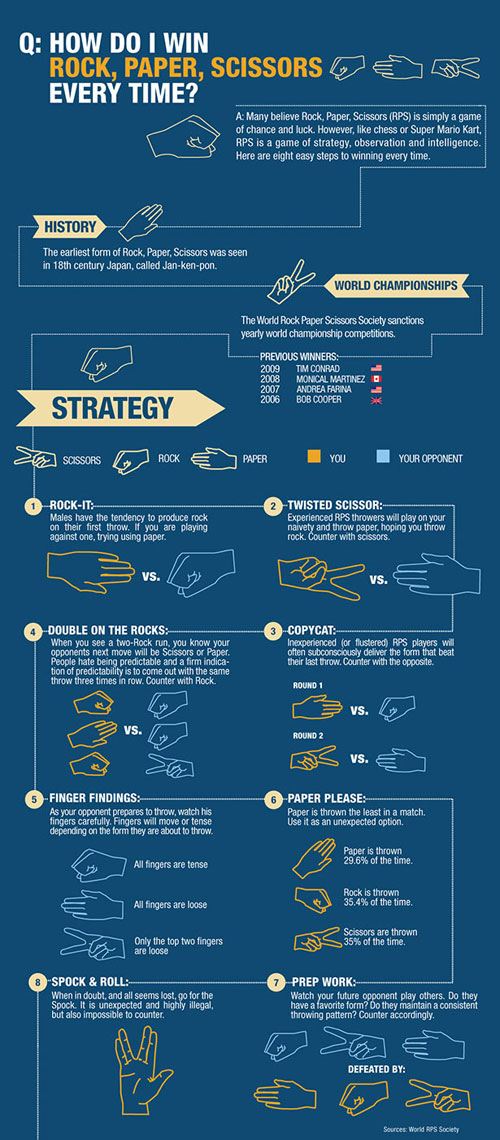
How Do I Win Rock Paper Scissors Every Time?
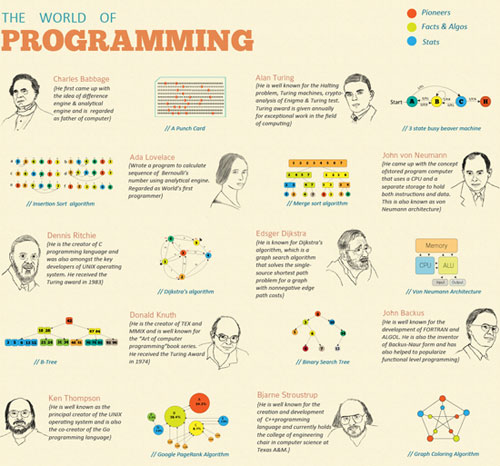
The World Of Programming Infographic
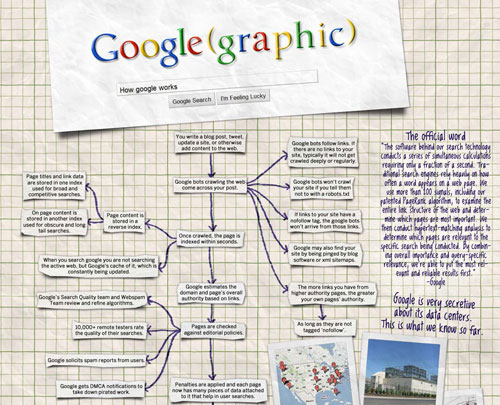
Learn how Google works
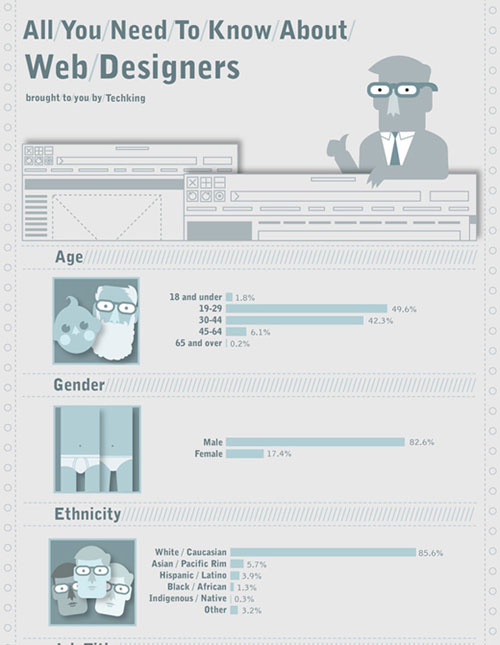
All You Need To Know About Web Designers
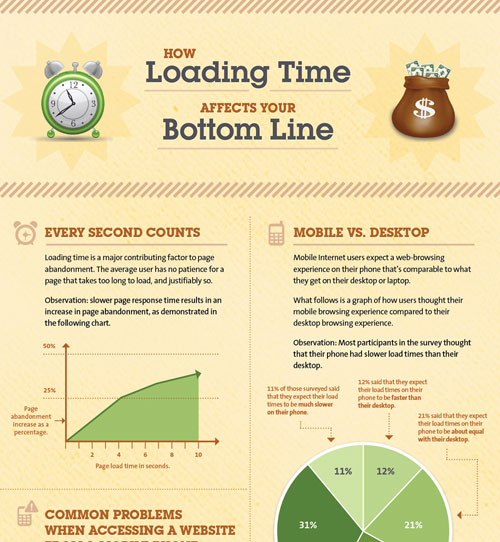
How Loading Time Affects Your Bottom Line
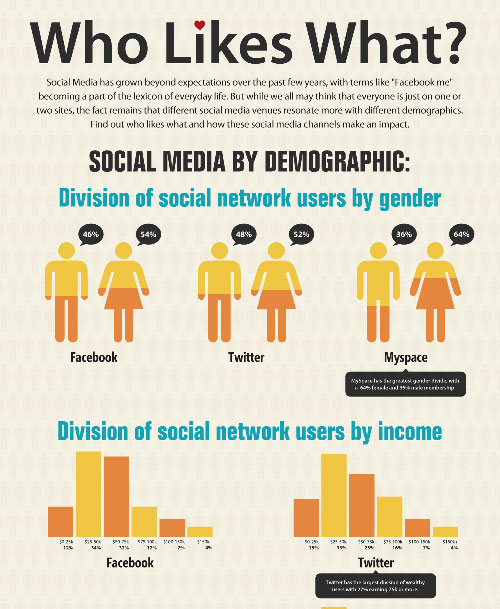
Who Likes What: Social Media By Demographic
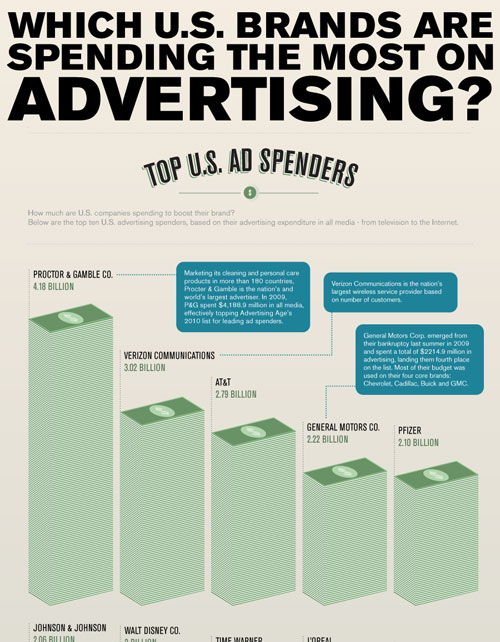
Which U.S. brands are spending the most on advertising?
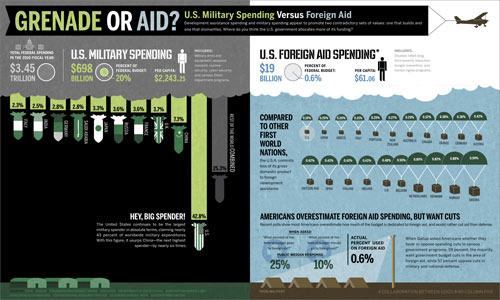
Grenade or aid?
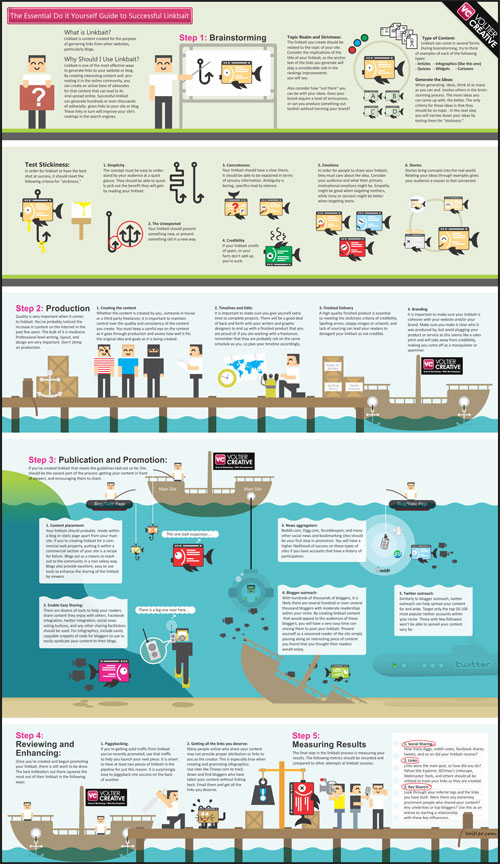
Linkbait
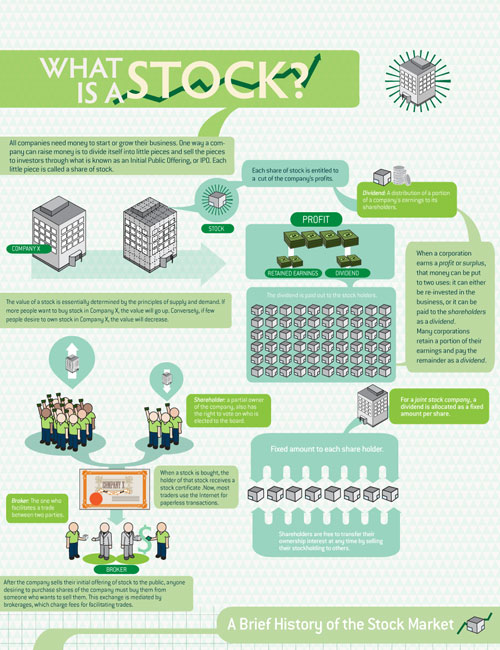
What Is a Stock?
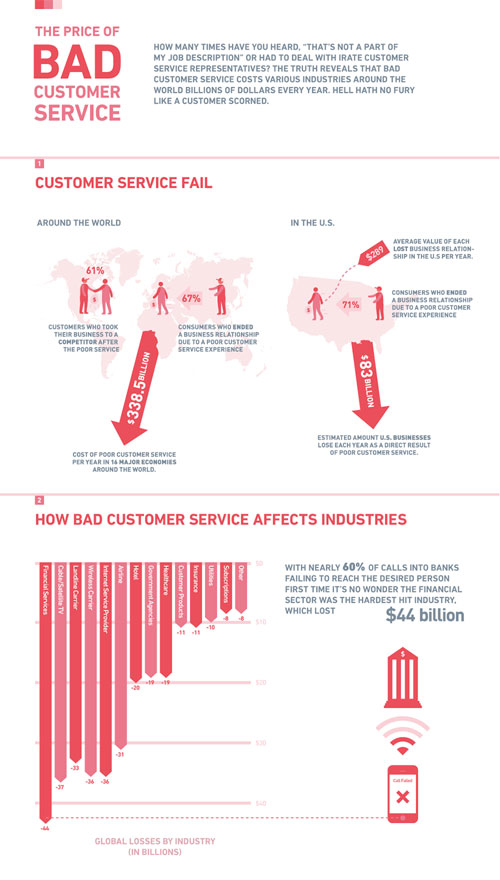
The Price of Bad Customer Service
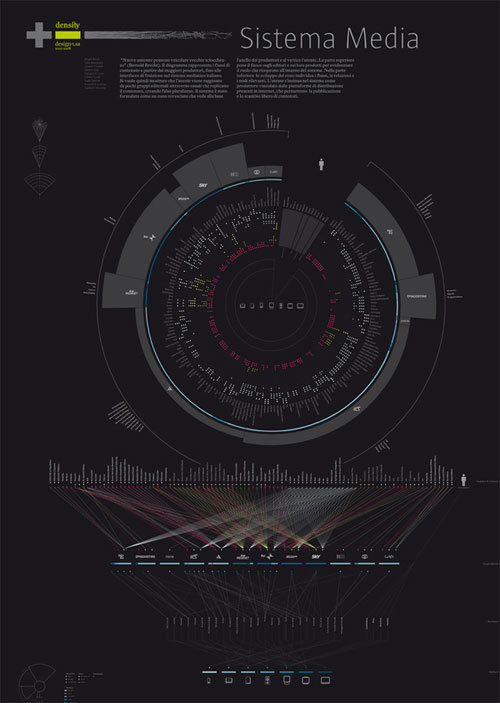
Italian Media System
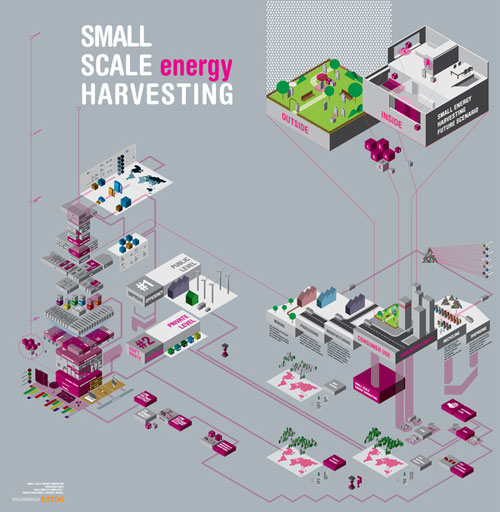
SMALL SCALE (energy) HARVESTING
And a bonus, just for fun
MOST POPULAR INFOGRAPHICS
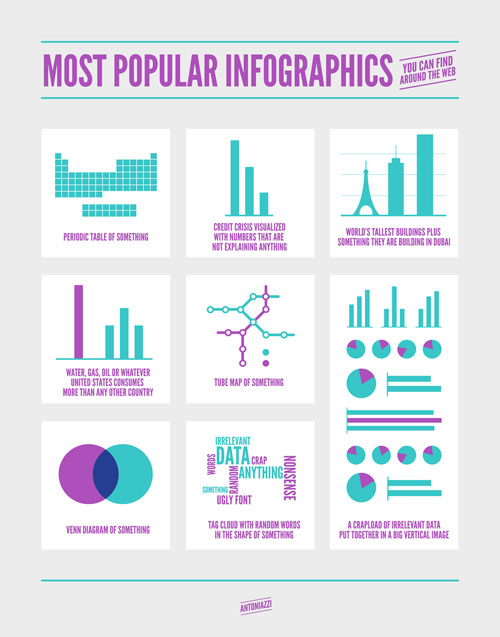
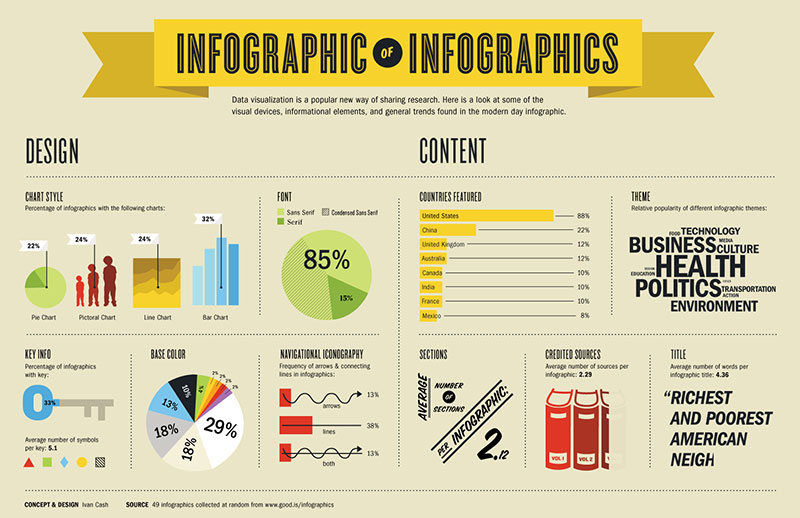
Infographic of infographics

There are also other infographic examples on this blog that you should check out.
FAQ on cool infographics
What Makes an Infographic ‘Cool’?
It’s the combo of data storytelling and design that’s so slick it sticks. Think eye-candy meets brain-food – a visual that not only looks great but packs a punch of info that’s super digestible. It’s about stirring interest and making people wanna know more, right from that first glance.
How Do Infographics Engage Viewers?
Engagement? It’s all in the readability and the user-friendly layouts. Infographics have this knack for simplifying complex data and serving it on a platter that’s a breeze to get. That, and they’re share-worthy – that means they’re pretty, punchy, and pique enough interest to spread like wildfire on social media platforms.
Can Infographics Go Viral? How?
Absolutely! It’s that mix of striking visuals and snappy info. If you nail the infographic distribution strategies, align it with what’s trending, and get it in front of the right eyeballs on the right platforms, you might just hit the jackpot and watch your creation take off on its own amazing race around the net.
What Tools Are Used to Create Infographics?
For the toolbox – you’re looking at software like Adobe Illustrator and Canva to online platforms like Piktochart. They’re like the Swiss Army knives for cooking up graphic design elements that pop and sizzle. You don’t need a design degree; just pick your weapon of creation and go wild!
Do Infographics Help in SEO?
Believe it or not, they’re ace for SEO content. A well-crafted infographic boosts stickiness, lowers bounce rates, and earns backlinks – all of which are gold for SEO. And when people share your visual stories, that’s when the sweet melody of organic engagement sings to search engines.
Are Infographics Good for Social Media Marketing?
Like peanut butter and jelly – infographics and social media are a match made in heaven. They’re bred for likes, shares, and comments. An infographic teases with bits of brilliance and beckons for that ‘share’ click – a perfect ally in the realm of content marketing.
What Elements Are Important in a Well-Designed Infographic?
I’d zero in on a gripping narrative, bang-on data visualization, and a design that’s easy on the eyes. Throw in compelling color theory, legible fonts, and an information hierarchy that guides like a map, and you’re cooking with gas!
How Can I Make My Infographics Stand Out?
Originality is king. Infuse unique illustrative statistics and custom illustrations that reflect your voice. Tap into interactive infographics – let your viewers play detective. Personalize – it speaks to peeps. And never underestimate the power of an unexpected twist in storytelling with data.
What Are the Biggest Mistakes to Avoid When Designing Infographics?
First off, don’t drown your audience in data. It’s a balance – keep it informative but not overwhelming. Clutter is a no-go. A chaotic color scheme can backfire big time. And, listen, forgetting narrative visualization is like forgetting the sugar in a cake – it’ll fall flat.
How Do You Measure the Success of an Infographic?
You’re looking for signs of life – comments, likes, shares, and especially backlinks. They’re like applause at the end of a show. Numbers talking is also good; check out how the traffic on your infographic marketing channel fares. Is your infographic a guest star in blog posts? That’s when you know it’s killing it.
Conclusion
Alright, let’s wrap this up. We’ve been on a wild ride through the land of cool infographics, diving deep into what makes them tick, click, and stick in the minds of everyone scrolling past them.
You’ve now got the insider scoop on crafting pieces that aren’t just easy on the eyes but also pack a solid info punch.
- Keep your stories compelling.
- Your designs clean.
- Your data on point.
And always remember, the secret sauce to creating something that resonates is to serve up a visual treat that’s both informative and impossible to ignore.
Keep pushing those pixels and weaving data into stories that demand to be shared. Now, step forth and create those show-stopping visuals. May your infographics not just be cool, but absolutely ice-cold.
Because in this game, where information meets imagination, it’s the coolest that stand out and make waves. And, hey, that’s precisely what you’re set to do now, isn’t it?
Renowned for his expertise in logo design and visual branding, Bogdan has developed a multitude of logos for various clients.
His skills extend to creating posters, vector illustrations, business cards, and brochures. Additionally, Bogdan's UI kits were featured on marketplaces like Visual Hierarchy and UI8.
He also wrote in the past years on sites like Design Your Way, WebDesignerDepot, WPDean, Designmodo, Speckyboy, Slider Revolution, and more.
- The Airtable Logo History, Colors, Font, And Meaning - 12 July 2026
- How to Blur Background in Canva: A Quick Tutorial - 11 July 2026
- Typography Trends - 10 July 2026
Bogdan Sandu is a seasoned designer who has been designing websites since 2008. Renowned for his expertise in logo design and visual branding, Bogdan has developed a multitude of logos for various clients. His skills extend to creating posters, vector illustrations, business cards, and brochures. Additionally, Bogdan's UI kits were featured on marketplaces like Visual Hierarchy and UI8. He also wrote in the past years on sites like Design Your Way, WebDesignerDepot, WPDean, Designmodo, Speckyboy, Slider Revolution, and more.
You Might Also Like