How this color blindness simulator works
This color blindness simulator shows how an image or a set of colors looks to someone with color vision deficiency. It runs a color vision deficiency model over every pixel, right in your browser, so a designer with typical color vision can see which colors merge. Your image is never uploaded.
Each filter rests on a published model. Brettel, Vienot and Mollon (1997) project colors onto a dichromat surface, and Machado, Oliveira and Fernandes (2009) added a severity scale from 0.0 to 1.0 that reaches the weak forms. This simulator uses the Machado matrices for protan, deutan and tritan vision.
Both models approximate a viewer with typical vision. A clean result tells you the obvious problems are gone. It doesn't certify the design.
How to use the simulator
- Add an image. Press Upload image, drop a file onto the preview or paste one from your clipboard. A sample color wheel, chart and status board are ready to try.
- Pick a vision type from the list on the left. Anomalous types have a severity slider.
- Drag the divider across the preview to compare normal vision with the simulated version.
- Scan the grid under the preview to see every type at once.
- Test a palette. Switch to Test colors, add up to eight colors, paste HEX codes or pull the main colors out of your image, and check which pairs blur together.
- Download the result as a PNG if you need to show a client or a teammate.
Severity works like a dial. At 100% an anomalous type matches its complete form, and lower values blend toward normal vision. This tool blends between normal vision and the full Machado matrix, so milder settings are a close approximation of the paper's precomputed steps, not an exact copy.
Which types of color vision deficiency can a simulator reproduce?
Most simulators cover the dichromat types (protanopia, deuteranopia, tritanopia) along with complete color blindness. Better tools also add the weak forms, which are protanomaly, deuteranomaly and tritanomaly. This color blindness simulator covers all of them.
The -opia types mean one cone class is missing, while the -omaly types mean it responds weakly.
| Type | What is affected | What you will notice |
|---|---|---|
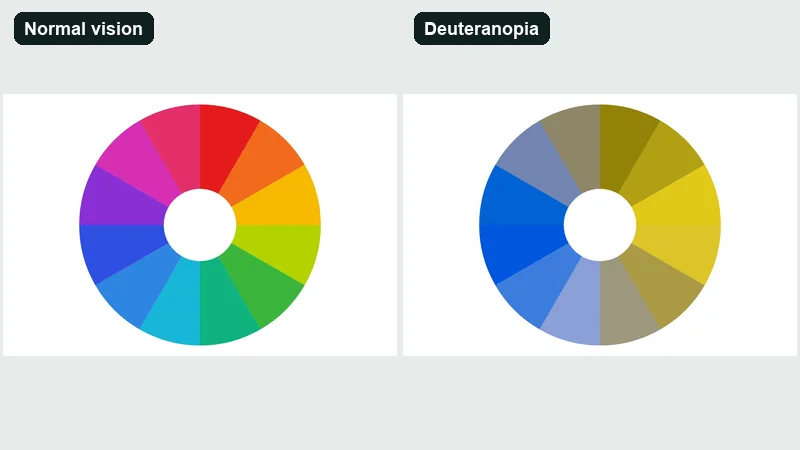
| Deuteranomaly and deuteranopia | Green-sensitive cones | Reds, greens and browns blend. Greens look duller and shift toward yellow. |
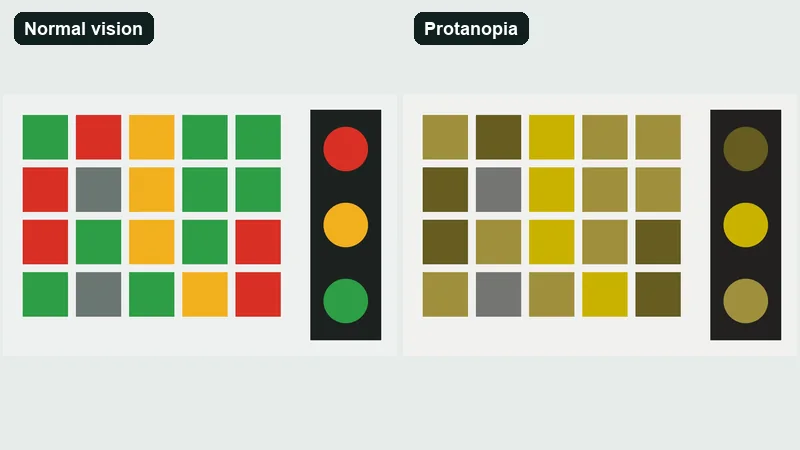
| Protanomaly and protanopia | Red-sensitive cones | Reds look darker and weaker. Red and green are easy to confuse. |
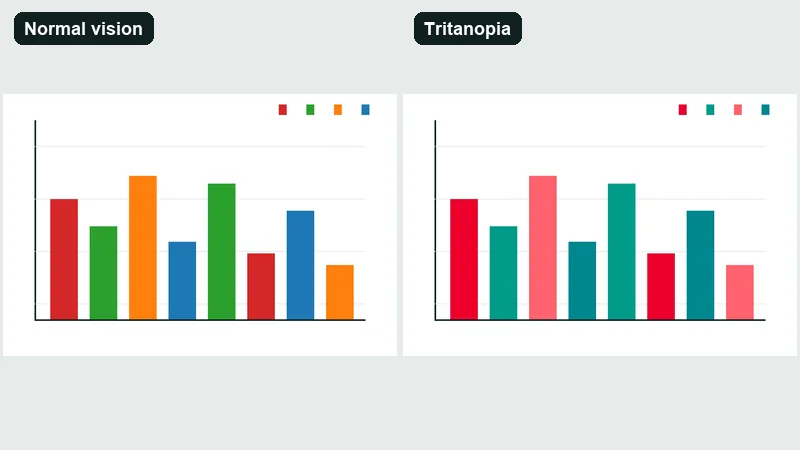
| Tritanomaly and tritanopia | Blue-sensitive cones | Blue and green blur together. Yellow and pink are harder to tell apart. |
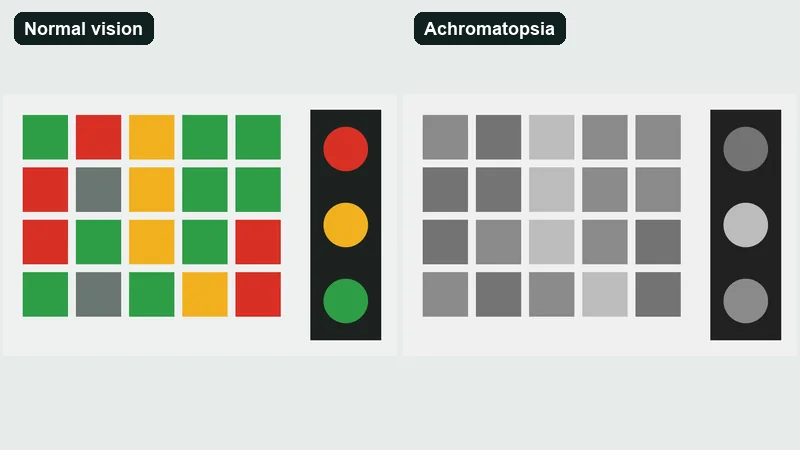
| Achromatomaly and achromatopsia | Cones overall | Little or no color. Everything depends on lightness. |
Red-green types
Protanopia means no red light is perceived, according to the Chrome DevTools documentation.
Deuteranopia is the green version of the same thing. Both problems sit on the red-green axis, and the confusion lines are close to identical.
Protanomaly and deuteranomaly are milder, with reduced sensitivity to red or green light instead of a full loss. Both red-green families are X-linked. That is why the numbers skew so hard toward men.
Blue-yellow and complete color blindness
Tritanopia takes out blue. Achromatopsia is the extreme case, where everything except shades of grey goes, and Chrome's documentation labels it extremely rare.
A workflow that only checks protanopia and deuteranopia never shows a blue-yellow problem, which is why the grid above includes every type.
Prevalence at a glance
1 in 12 men (8%) have color vision deficiency, compared with 1 in 200 women (0.5%) (Colour Blind Awareness).
Worldwide, the count is about 300 million per Colour Blind Awareness, against roughly 200 million in Machado, Oliveira and Fernandes (IEEE TVCG, 2009). The two estimates come from different sources and years, so they are not a like-for-like pair.
Severity varies a lot. About one-third of color blind people are affected strongly, and the rest have milder forms (Adobe documentation).
Testing a palette
Switch to Test colors to check a palette. Add up to eight colors with the pickers, paste a list of HEX codes, or use Check its main colors in the image tab to pull the main colors out of your picture.
The grid shows each color as seen with every vision type. Below it, the simulator ranks every pair of colors by how easy they are to confuse for the type you picked. Click any swatch to copy its simulated HEX code.
How do you run a simulation on a webpage, an image or a live screen?
The input decides the method. Images and palettes go through this tool. Live webpages are easiest to check in the browser's own DevTools.
Testing a webpage in the browser
- Open the page in Chrome and open DevTools.
- Open the Rendering tab (More tools > Rendering).
- Find "Emulate vision deficiencies" and pick Protanopia (no red) from the dropdown.
- Check status colors, chart legends, links, form errors and focus states.
- Repeat for Deuteranopia (no green), Tritanopia (no blue) and Achromatopsia (no color), then reset to "No emulation".
The dropdown also lists blurred vision and reduced contrast (Chrome for Developers). The color options were added in Chrome 83, released in 2020.
Firefox handles the same job from the Accessibility Inspector. Hit Simulate in the panel toolbar, next to Check for Issues, and pick protanopia, deuteranopia, tritanopia, achromatopsia or contrast loss (Firefox Source Docs).
Testing an image or a design file
Export the screen or artboard as a PNG or JPG and drop it into this simulator. For a design with several states, export each one, because the filter only sees what is in the file.
What goes wrong in practice
People test only protanopia and call the design safe. Another common miss is checking the default state and skipping hover, focus, error and disabled states.
Leaving a browser emulation switched on is the quieter mistake, because you end up misreading the real colors later.
How does a simulator calculate what colors look like?
Each pixel gets converted into cone responses (LMS), the response of the affected cone class is removed or shifted, and the result is converted back for the screen. Machado's 2009 model folds that whole chain into a single matrix multiplication.
The last step returns the image to ordinary RGB values, so the display has the final say on what you see.
Dichromat simulation
Brettel, Vienot and Mollon set the baseline in 1997. Their algorithm treats each color as a vector in LMS space and replaces it with its projection onto a reduced stimulus surface (Journal of the Optical Society of America A).
Greys are left unchanged, on the assumption that they look grey to dichromats. The anchor wavelengths are 575 nm yellow and 475 nm blue for protan and deutan simulations, and 660 nm red and 485 nm blue-green for tritan.
For validation, a protanope and a deuteranope accepted the match between the original and the simulated image.
Vienot, Brettel and Mollon followed in 1999 (Color Research and Application) with LMS-based colormaps for digital video displays, which meant making some practical compromises.
Severity and anomalous trichromacy
Brettel's model has one setting per type, and it assumes the cone is gone. Machado, Oliveira and Fernandes added a dial.
| Attribute | Brettel et al. 1997 | Machado et al. 2009 |
|---|---|---|
| Forms covered | Dichromacy | Normal vision, anomalous trichromacy and dichromacy in one framework |
| Severity control | None, full cone loss only | 0.0 to 1.0 in steps of 0.1 |
| Calculation | Projection in LMS space | One matrix multiplication per color |
| Validation | Protanope and deuteranope matched the result | Experiment with color vision deficient and normal-vision participants |
In Machado's scale, 1.0 is dichromacy and 0.0 is no deficiency. Dichromacy equals an anomalous trichromat with a 20 nm spectral shift, and values between the precomputed matrices are interpolated (UFRGS project page).
The sources don't fully agree here. Chrome's documentation says designing for the extreme simulations covers protanomaly, deuteranomaly, tritanomaly and achromatomaly, and also admits the weak forms differ from person to person. Machado's figures show contrast loss growing steadily with severity.
They answer different questions, though. Chrome gives a worst-case design rule, and Machado gives a perception model.
Run the extreme types first. Reach for a severity slider only when two colors separate under dichromacy by a thin lightness margin.
When can you not trust a simulator result?
Be suspicious of the output when it's your only evidence, or when the screen isn't an sRGB display. The same goes if the person you design for has a weak form. A simulator applies a general model for a viewer with typical color vision, so it cannot report what one specific person sees.
| Situation | Why the result drifts | Source |
|---|---|---|
| One individual's vision | General models do not capture an individual's color discrimination, and personalized simulations proved significantly more accurate than the existing models | Flatla and Gutwin, 2012 |
| Anomalous trichromacy | Models built on tristimulus values cannot predict anomalous Rayleigh matches | Yaguchi et al., JOSA A, 2018 |
| Non-sRGB or uncalibrated display | The 1999 Vienot adaptation was made for the sRGB video display only | IPSJ Transactions on Computer Vision and Applications, 2015 |
| Two tools disagree | No standard method for comparing simulation methods had been defined | Simon-Liedtke and Farup, J. Imaging Sci. Technol., 2016 |
A pass means the colors separate on the model's axes. It doesn't mean a color-blind person confirmed the design.
A simulator is also not a diagnostic. It transforms an image and says nothing about which type a person has.
Set the display profile to sRGB before judging borderline pairs. Then use the simulator to find problems, not to declare a design safe.
What should you fix after a simulation shows a problem?
Start by adding a second cue wherever color carries meaning. After that, pick colors that differ in lightness and check the contrast ratios.
WCAG 2.2 success criterion 1.4.1 (Level A) says color cannot be the only visual means of conveying information, and the W3C names shape or text as the pairing.
Add a second cue
Status badges in a dashboard interface are the usual casualty. A green "Paid" and a red "Overdue" of similar brightness sit on the red-green confusion axis, and the only thing separating the two badges is hue.
The fix is blue (#0072B2) for Paid and vermilion (#D55E00) for Overdue, with a check mark and a warning triangle inside the badges. The word itself stays visible at all times.
Okabe and Ito make the same case for charts: label elements directly instead of leaning on a color-coded key, and use line styles or hatching where lines would otherwise differ only by hue (Color Universal Design).
Choose a safer palette
Okabe-Ito is the safest default for categorical data. It's eight colors from the Color Universal Design guide by Masataka Okabe and Kei Ito (first published in 2002, updated in 2008).
ColorBrewer offers a "colorblind safe" option under "Only show". The rating depends on the palette and the number of classes, so recheck it when you change the class count.
Viridis comes with a vignette that simulates deuteranopia, protanopia and tritanopia. The maps hold up under the first two and do less well under tritanopia.
Okabe and Ito also list pairs to drop, including red text on black or dark backgrounds, red on green, yellow next to yellow-green, and blue next to violet.
GitHub's colorblind themes swap red and green for orange and blue. On April 19, 2022 it split them into a protanopia and deuteranopia theme and a separate tritanopia theme (GitHub changelog).
Blue and orange are a pair that stays apart for most types of red-green color blindness, and different lightness keeps even close hues apart.
Check contrast, because the simulator will not
WCAG 2.2 success criterion 1.4.11 (Level AA) requires at least 3:1 for user interface components and graphical objects. The threshold is strict, so 2.999:1 fails (W3C).
When hue fails, lightness carries the separation, which makes color contrast the main repair. Our color contrast checker computes the ratio from two colors and reports a WCAG pass or fail.
It does not simulate any color vision deficiency, so it can't replace the simulator pass.
Color blindness simulator FAQ
Is a simulator the same as a color blindness test?
No. A test such as the Ishihara plates screens a person's own vision, while a simulator transforms an image for a viewer with typical vision. A simulator cannot tell anyone which type they have.
Is my uploaded image sent to a server?
No. This simulator does all of its work in your browser, so images and colors stay on your device. That makes it safe for unreleased mockups.
Can I simulate color blindness on a phone?
Yes. This color blindness simulator works in a phone browser. Take a screenshot or a photo, upload it and drag the divider. For live camera filters, check the store listing of any app you choose.
How is a system color filter different from a simulator?
System color filters, like the ones in iOS and Windows, adjust the display for whoever is using the device. Simulators work the other way around and show a designer what a color-blind viewer sees.
Corrective filters are not a substitute for testing a design.
What is daltonization, and does it fix an image?
Not really. Daltonization recolors an image so colors a color-blind viewer would confuse become easier to separate, but it works on the viewer's side.
The design itself still needs a second cue or a safer palette.
Can a person with color blindness use a simulator?
Yes, mostly to show other people what their vision is like. The result is a general model, so it can differ from what that person actually experiences.
Where a color blindness simulator belongs in your workflow
Run the simulator twice, once when you pick the palette and again before release. Those are the two moments when a failed check still changes the design, and final sign-off belongs to a person.
Passing the extreme types shows that colors on the red-green confusion axis separate. Models built on tristimulus values cannot predict anomalous matches, so a reviewer with deuteranomaly or protanomaly tests what the filter cannot.
At the palette stage, choose a safer scheme and simulate it. During the build, add icons and labels and run protanopia and deuteranopia. Before release, run all four types, check the 3:1 ratio, and test with one reviewer with a weak form.
That order puts the cheapest repairs first. The cost is one extra review round, which no filter replaces.