

Dashboard design. Is it easy? Far from it. Great dashboard UI designs are developed daily to remind us of the unlimited possibilities we have to present data in a creative way.
Rather than getting heaped with information we can’t understand, dashboard UX designs help us understand what is really important, and open up a data wonderland where we can understand everything, interpret everything, and make use of the story it is telling us.
User dashboards are becoming increasingly important as the digital age showers us with more and more data.
They help to prevent us from drowning in that sea of data, or at least the good ones do. Great user dashboards are like windows into a data wonderland. They help users to navigate data, to interpret it, and to unravel the story the data is trying to tell us.
Before moving any further, I’ll leave some quick navigation below so you can jump to the desired section of the article:
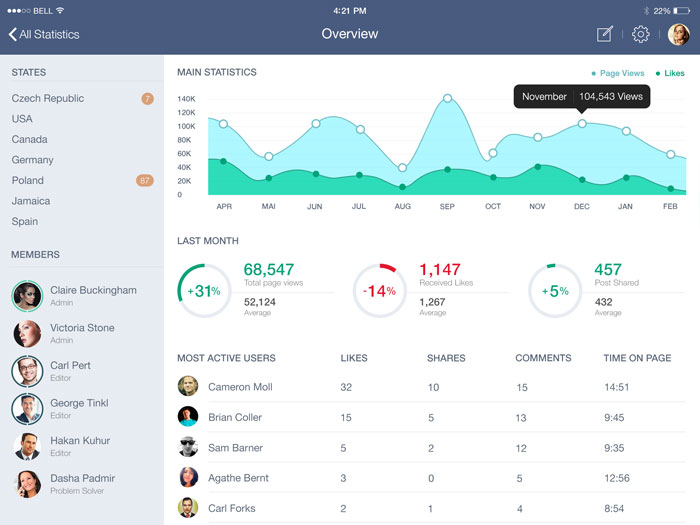
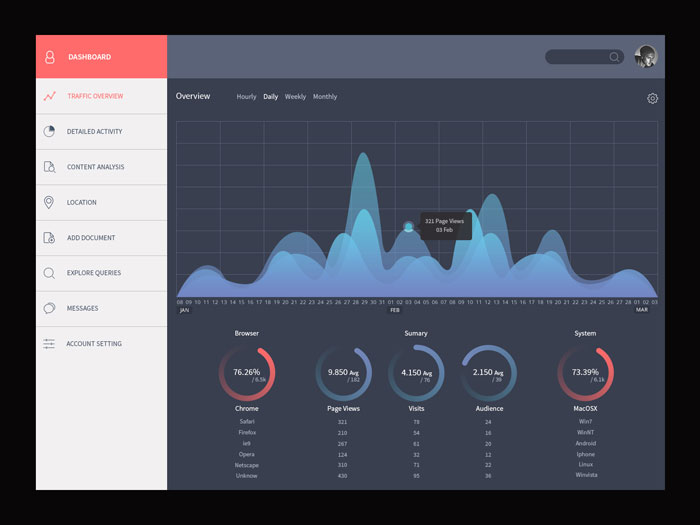
The best user dashboards out there organize data in a way that makes it easy to understand where information is coming from.
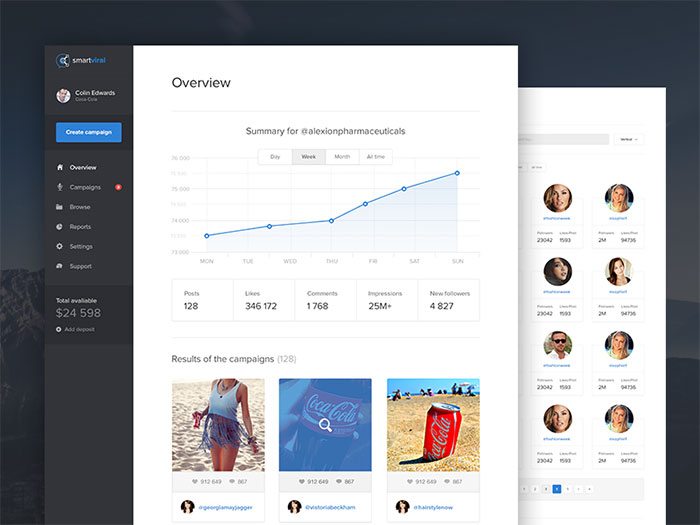
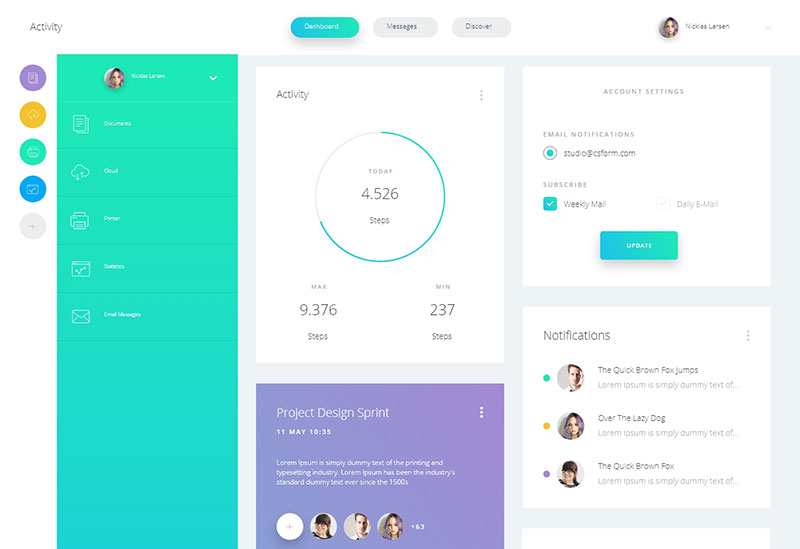
Image source: Krzysiek Kozioł

The best dashboards also make it possible to monitor the progress of data and reflect each change that has happened to it, as minor as it may be.
In the ideal scenario, a dashboard UI would divide all info into bars and sections, but screen estate will rarely allow this in real terms.
What is more important in UX Design and UI design is visual order, and whether the viewer understands how elements are correlated, and depend on each other.
Dashboard design may be the hottest trend right now, but your web designing experience, even in large agencies, won’t necessarily make you good at it. The process is fairly challenging, which is why we recommend you to look at our digital dashboard tips and best dashboard samples.
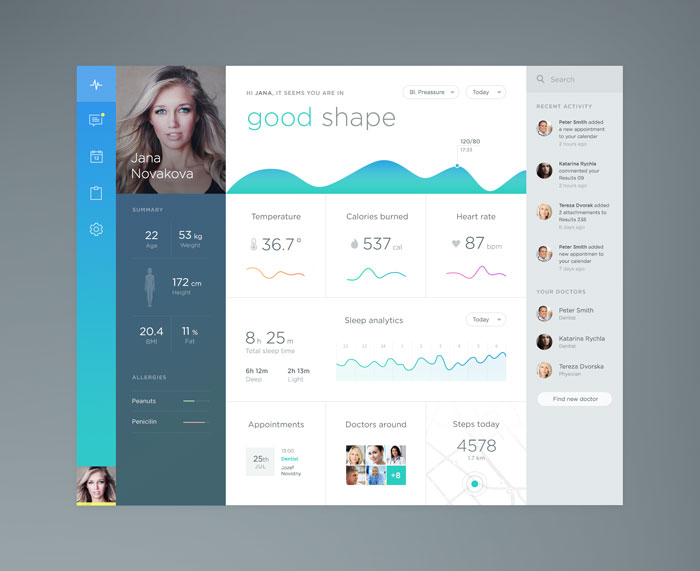
Get to know your users
Image source: Garrett Godsey
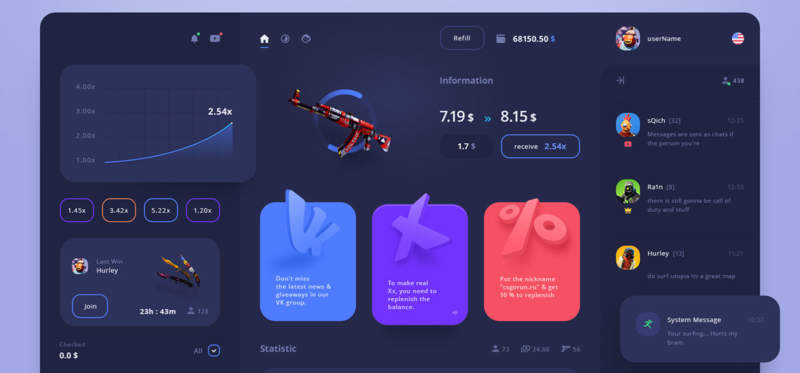
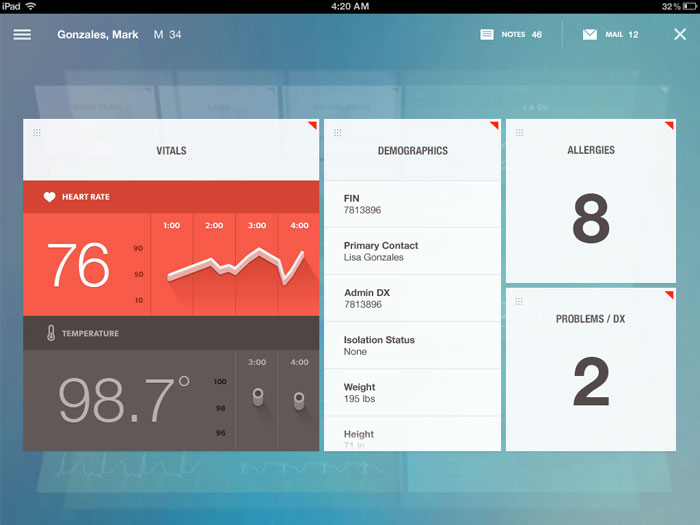
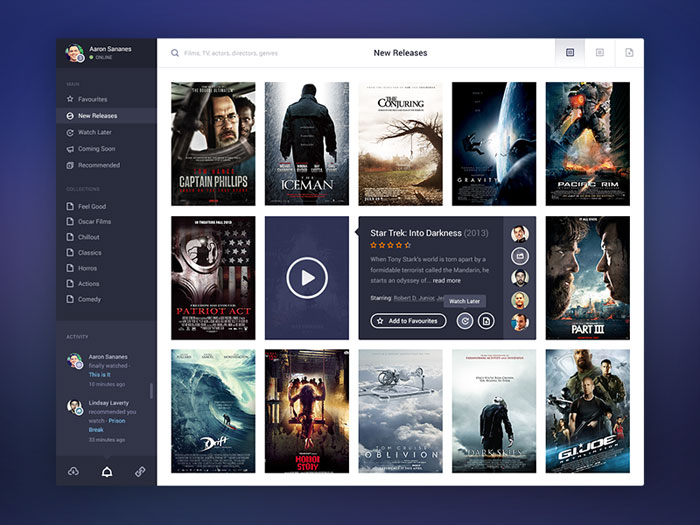
Who said dashboards were all about data?
What matters the most in dashboard design is whether it provides enough information for users to have their questions answered.
Basically, dashboards provide valuable knowledge that must be cut to cater to different needs, but that doesn’t mean you should simply throw all data you can think of on the screen in order to meet them.
And well, that’s the challenging part about UI design.
You must have a clear idea of who your audience will be, and build a dashboard that will indeed be useful to them.
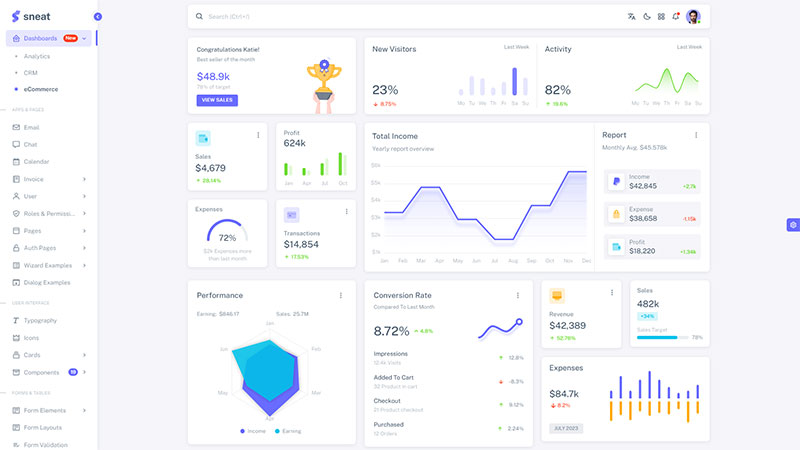

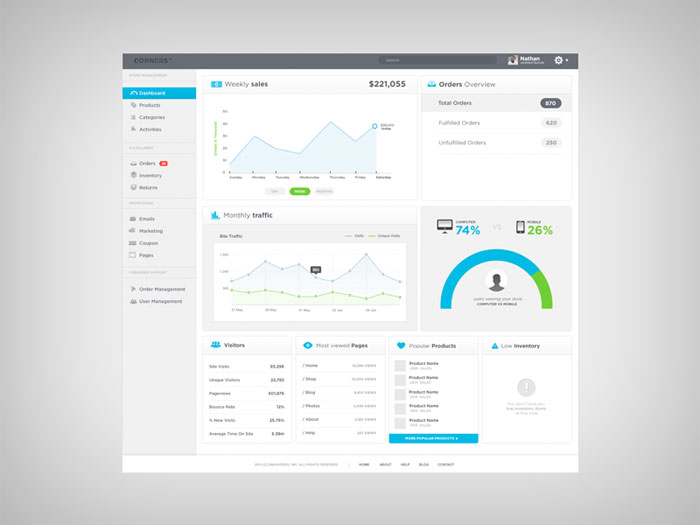
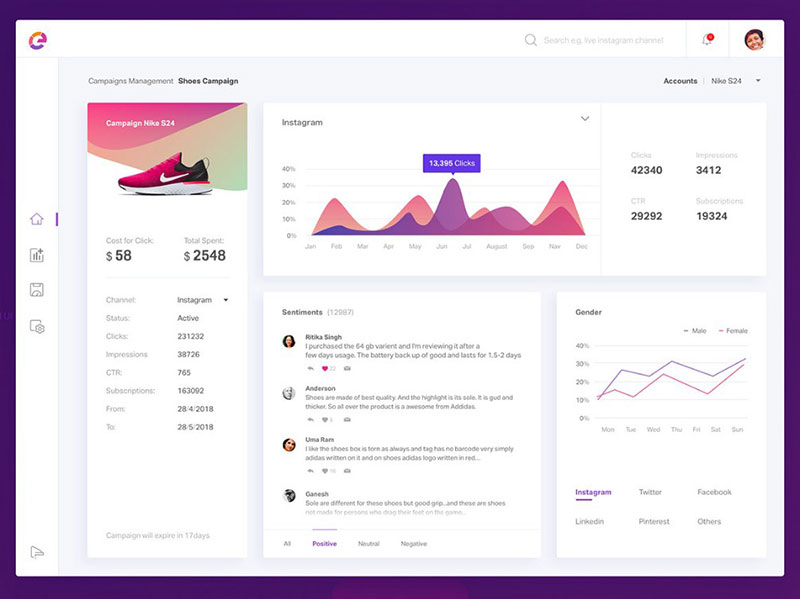
For instance, you check the above admin dashboard for better understanding. This eCommerce dashboard is a part of the Sneat NextJS Admin Template. It is a great example of an interactive dashboard for eCommerce data.
Try to discover their objectives, and think of questions they might want to answer. This will give you at least a basic idea of how the dashboard should look.
Don’t overwhelm users with data

Image source: Bradley Bussolini
When choosing information to present on the dashboard, try to answer one essential question – Do users need that information?
If yes, find a way to bundle all of it on the screen.
If not sure, simply skip it. Users don’t like being burdened with useless and unprocessed data, but are rather looking for ‘digestible chops’ that won’t take too much time to understand.
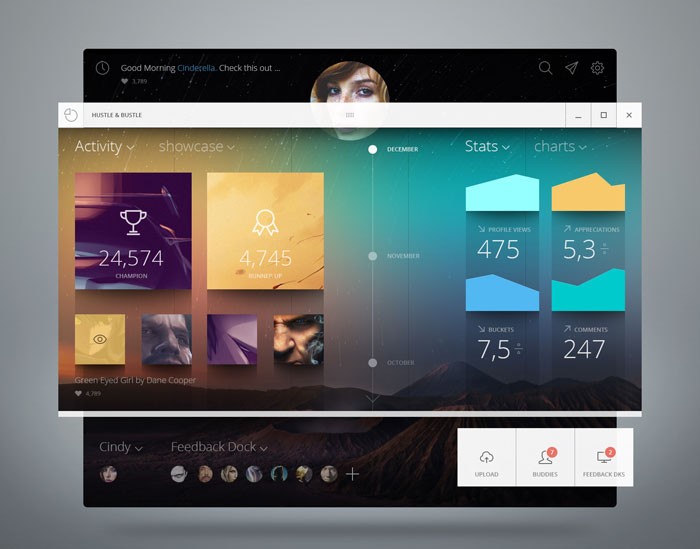
Start with a basic overview, but make sure interested users can drill into details
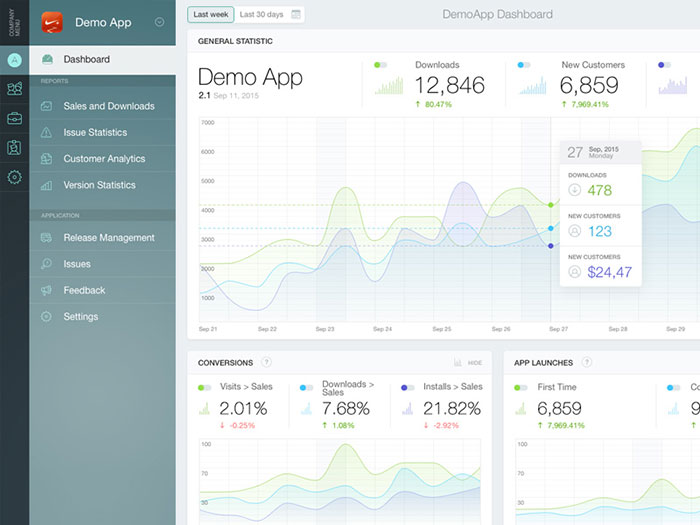
Image source: Serge Tiutyk
Think of your prospective dashboard UI as a popular newspaper – you pick it up, glance quickly at the front page, and decide what is important for you to see.
Then you only return to the important section of the paper, unless the overview is so good that you don’t need to find out more.
This is how your front page is supposed to work – users will see all important info, and then read more on data that is relevant to them.
All of this is possible only with visual hierarchy and quality design.
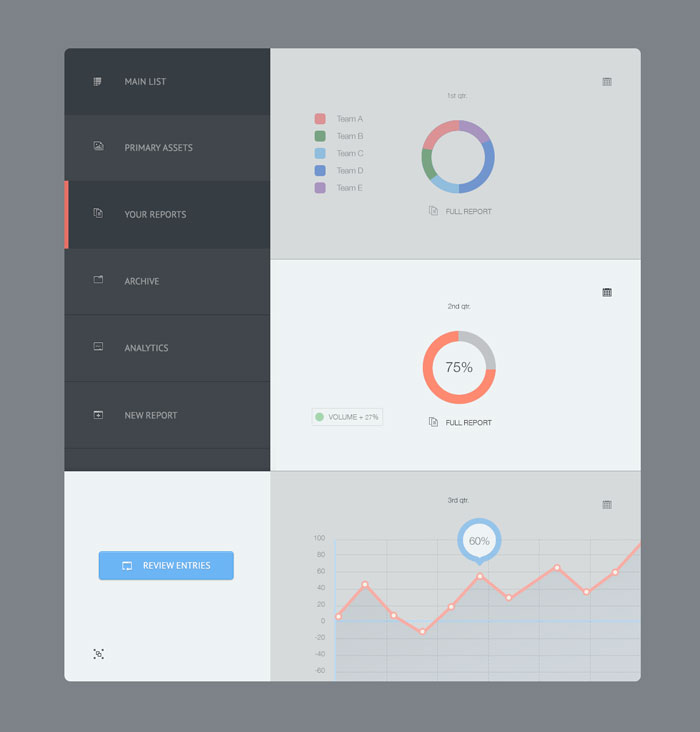
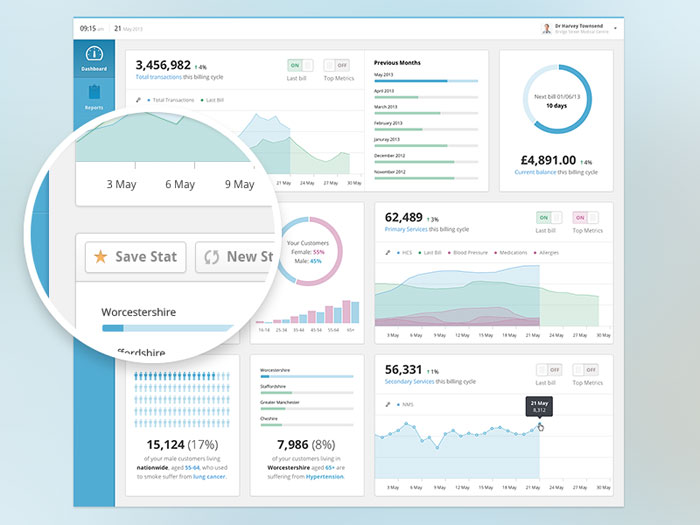
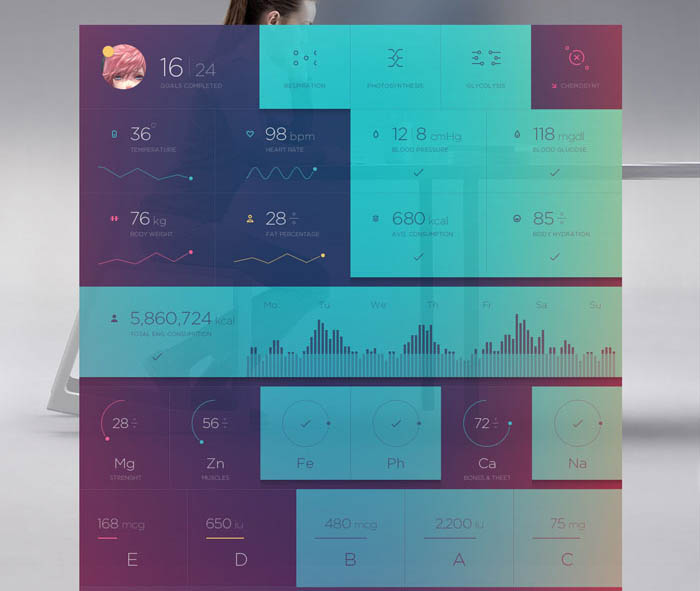
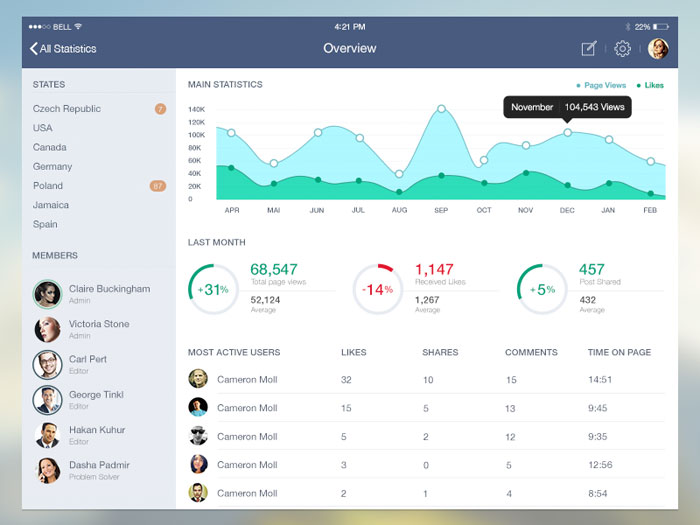
Design helpful visualizations
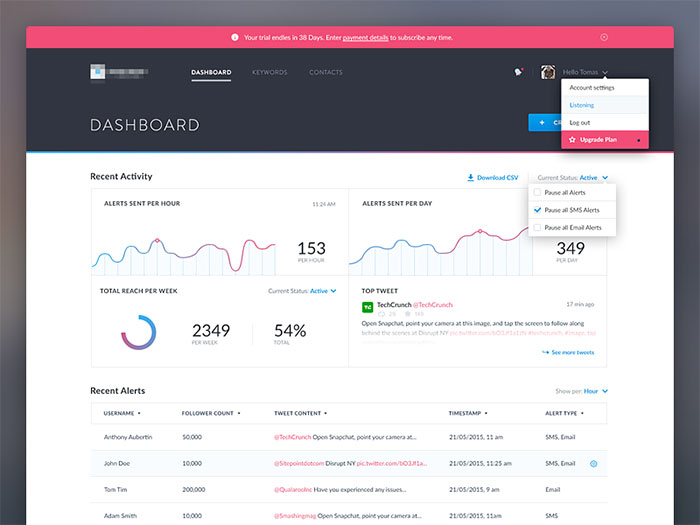
Image source: Konrad Księżopolski
Data visualizations are priceless in UI design, including plots, charts, and graphs that help users understand and analyze your data.
Try to keep things simple, as too much visualization may look less attractive to users.
Basically, this is the moment when you decide how you’re going to tell your data story, and that depends entirely on the nature of that data.
In some cases, pie charts may be better than regular ones, while complex graphics and top visualizations should be avoided almost in all cases.
Add interesting and functional animations
Surprising transactions, as cool as they seem, won’t work everywhere.
Therefore, try to restrict their usage. There is nothing wrong with a static image looking to share some really important information.
When and how can animations help users?
Before you decide to bring your dashboard design to live, you have to decide which type of animations would be most interesting to your users.
As you know, dashboards consist of several data portions coming from a variety of sources, and will, therefore, take time to upload. This is exactly the gap animations fill to ensure users won’t notice the loading delay.
The choices and solutions are simply endless – preloader icons, custom waiting messages, percentage loading bars, and many more.
Another cool idea is to leave the dashboard empty and then show data step by step as it is uploaded.
Think of this as starting the engine in the car – you wait for it to pick up the pace, and start driving only after it.
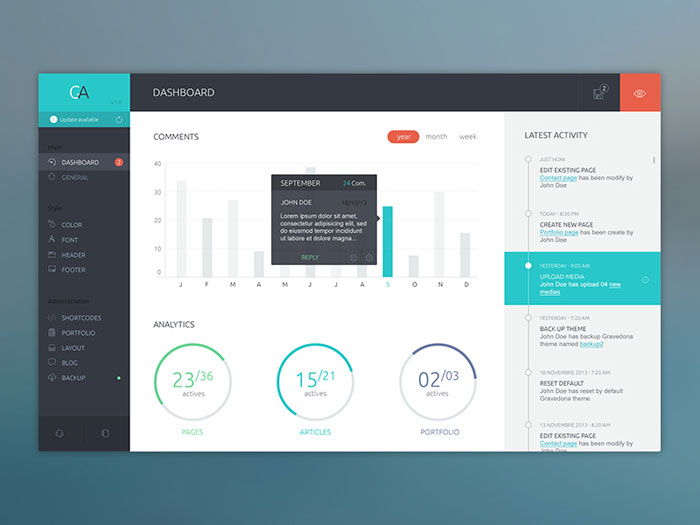
Provide intuitive orientation and navigation
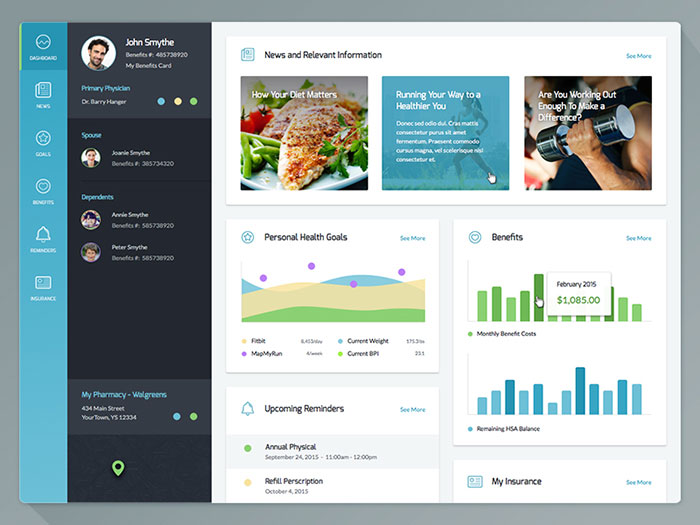
Image source: Rob Luke
Most dashboards are in fact a set of pages rather than a single one, and hide more details than what is visible on first sight.
This is why you must ensure users can find their way easily, and navigate from one dashboard to the other without hassle.
What this means is that you should work with familiar patterns (tabs on the top, left-handed menus, etc.) users have already seen somewhere else, or at least tag items with clear signposts and labels that would let them know what they are doing.
The options you have are once again overwhelming, so make sure you test in advance the breadcrumb train and dashboard hierarchy you’re planning to apply.
Keep the dashboard UI clear and uncluttered
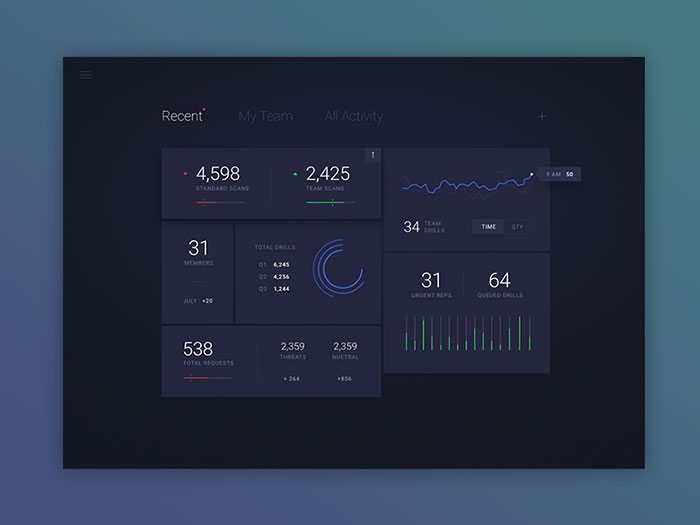
Image source: Sam Thibault
How do you recognize a good dashboard? The first indicator that you’re working in an organized environment is that there is nothing that could compromise your experience, be that extra text, imagery, or confusing graphics.
Use the best design practice you can find, make sure related information is visually united, and all elements are aligned to exhibit the connection between them.
In this case, you will end up having an uncluttered dashboard users like to work on.
Focus on legibility when designing a dashboard
In order to make sure users can extract and process information and visual stimuli without problems, use fonts that are easy to read.
After all, your interface is supposed to guide users and motivate them to take action, not the other way around.
Color can also help your dashboard UI
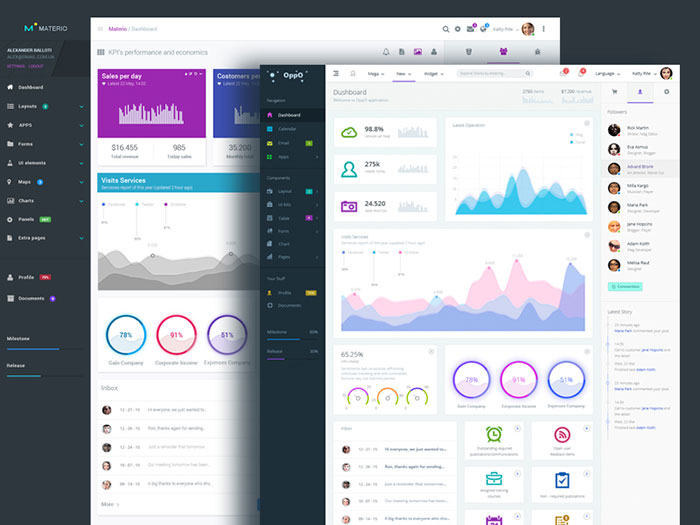
Image source: Yavick Zaytsev
Colors have plenty to do with how users perceive and analyze information.
A basic research of color psychology will tell you which shades work the best for all types of information, as for instance that red, green, and amber communicate statuses and low/high value indicators.
Keep the scheme simple and consistent, as this makes your information more credible.
Guidance and help should be available at any moment
In the best of all worlds, a dashboard UI would speak on its behalf, and there will be no need to explain whatever.
However, odds are good not every user will understand what you were trying to say, and the poorer your design is, the longer this list will be.
This is why you must secure additional assistance and guidance, especially for users landing on the page for the first time. Access to contextual help should also be provided for more specific questions.
Go no further than design patterns users have already seen
Use only the design patterns, icons, language, and visualizations you think users are familiar with, as your novel story telling ideas don’t have an effect equivalent to their looks.
Generally, the best approach is to use popular and standardized patters you may not really like, but which can help your users navigate the dashboard without any problems.
Check how the dashboard is actually used
An important step in designing any web or mobile app is understanding if your ideas actually match with reality: do your users navigate and use your dashboard the way you thought they would?
For that, you can use a session recording tool. Such tools allow you to record your website visitors and review these recordings later, providing invaluable insights into how exactly your users browse your website, and what they pay attention to.
Reviewing session replays can help you understand if important information is clearly visible on your dashboard, if users need to make additional clicks to get to the data they desire, and if they wish for something else to be easily accessed through the dashboard.
Dashboard UI design inspiration
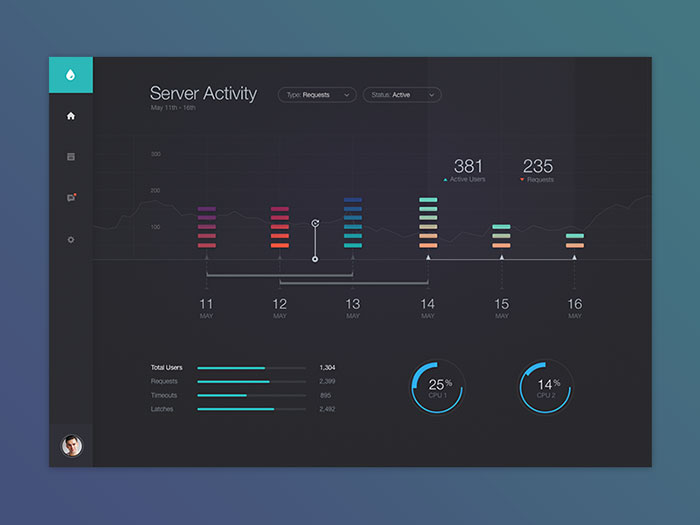
Image source: Sam Thibault
A dashboard is a set of graphical menus and interfaces that give the user quick access to data and information as well as simplify any editing processes they might need for a website or even an application.
In most cases, a dashboards UI will contain information such as stats, analytics, schedules, messages and much more. Essentially, a dashboard is a user interface designed to interact with the back-end of a website or application that makes it easier for the user to make changes and access information.
Think of it as a control panel or admin panel that gives users access to all the necessary data to perform virtually all the functions of a site or application.
Data visualization can be a difficult task for even the best designers and not all designers are suitable for dashboard design.
When done correctly, UI dashboards will truly stand out to a user and the applications or websites using them will receive praise and even increased usage because of the fantastic design.
These dashboard designs are often colorful with a fantastic layout that make it easy for anybody to control the site or application and make intuitive decisions.
Dashboard UI design is not a typical element that designers often focus on. But, they are extremely important to the user experience.
Proper research and planning is a must before designing a dashboard UI and when developing a dashboard, you must consider perfect design to create a user experience that is both intuitive and useful to anyone who will use it.
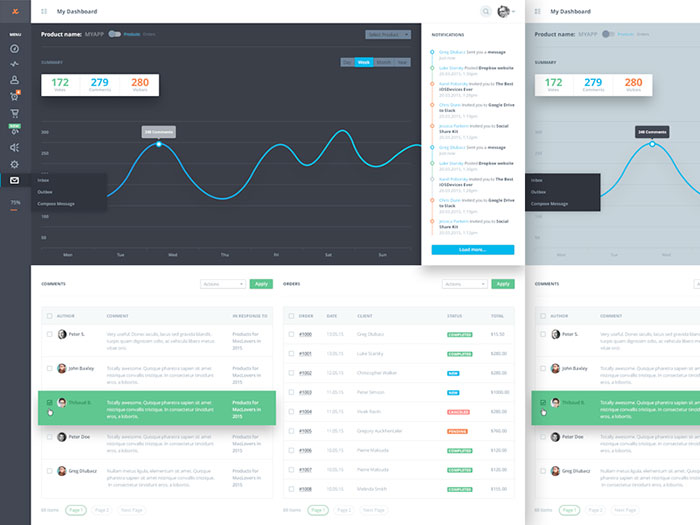
Dashboard
Dashboard UI Kit
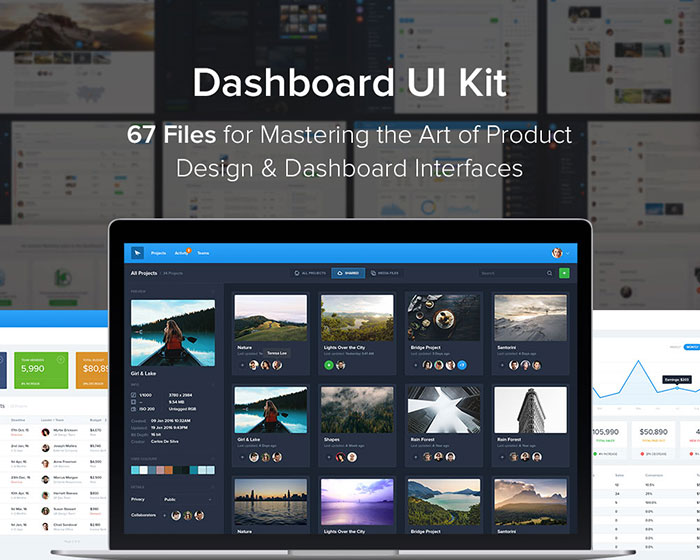

Biggest pack focusing on designs of Dashboard User Interfaces & Web Applications to help you quickly prototype and design beautiful interfaces your clients and users will adore. 75 Screens with all various layouts.
All packed with 2 Typeface versions – with Free Google Font Source Sans Pro & secondary Proxima Nova. Everything is based on 1170px Grid system (30px & 1580px canvas width). 2017 Update as well brings design of a conceptual app for freelancers called Workspace.
This time with all connected screens to give you another guide for your new dashboard visual language. All Workspace screens also comes in both White and Black versions.
And lastly but also mainly this update gives you by your hand one of the biggest elements pack full of all possible states or every possible form/table elements you can ever think of.
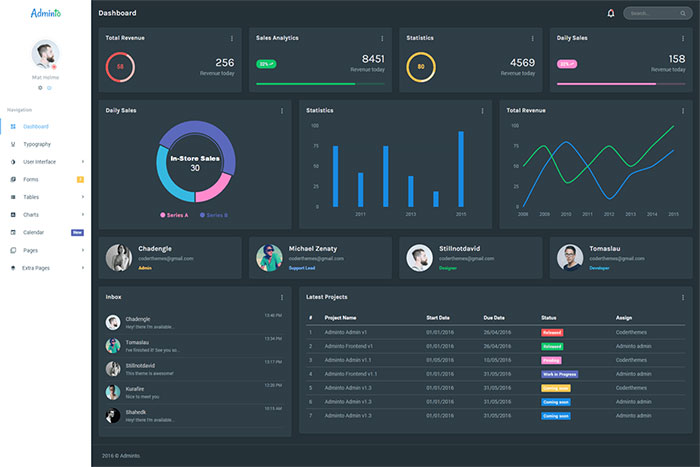
Adminto – Responsive Admin Dashboard

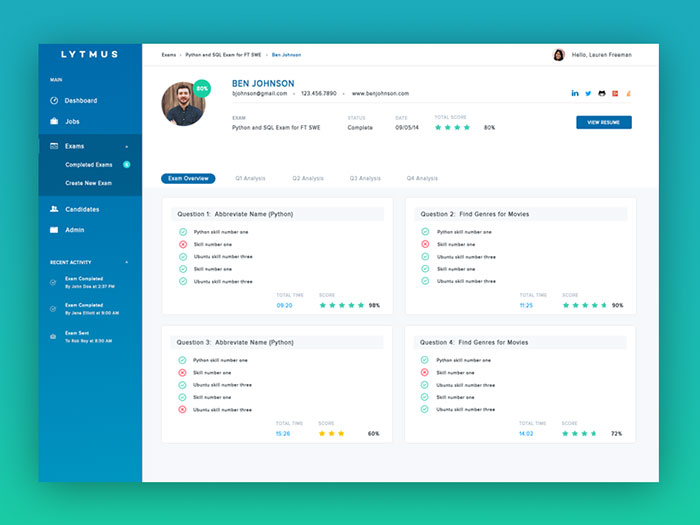
Code Exam Dashboard design
Material Dashboard
Logged-In Dashboard design
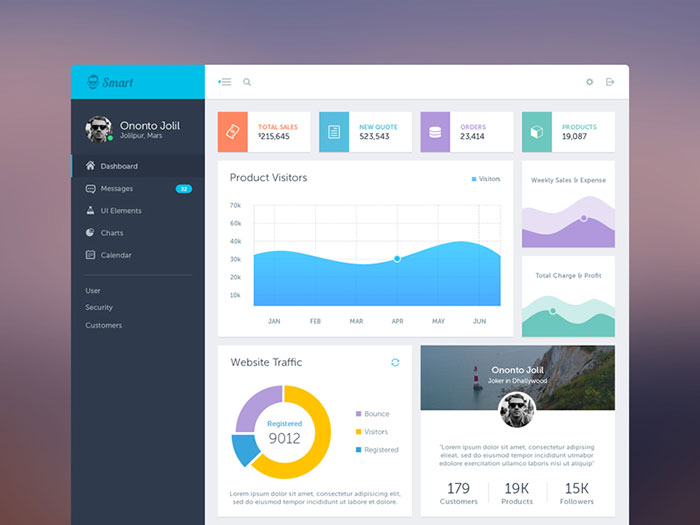
Smart Admin Dashboard
Dashboard orange UX
B2B Dashboard
Dashboard for Employee fitness app
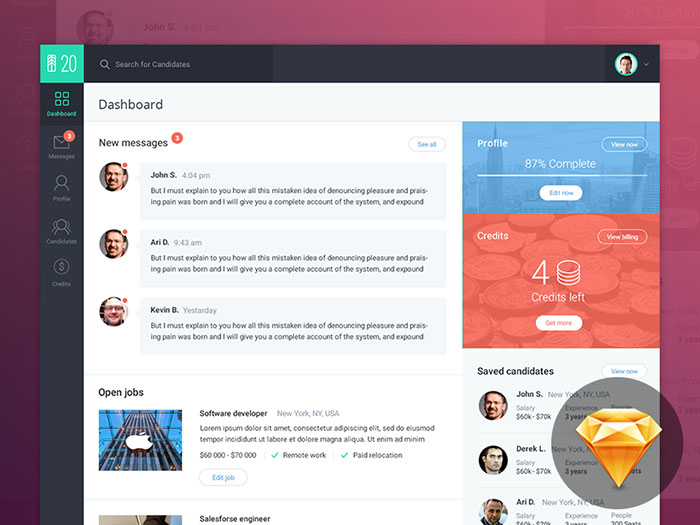
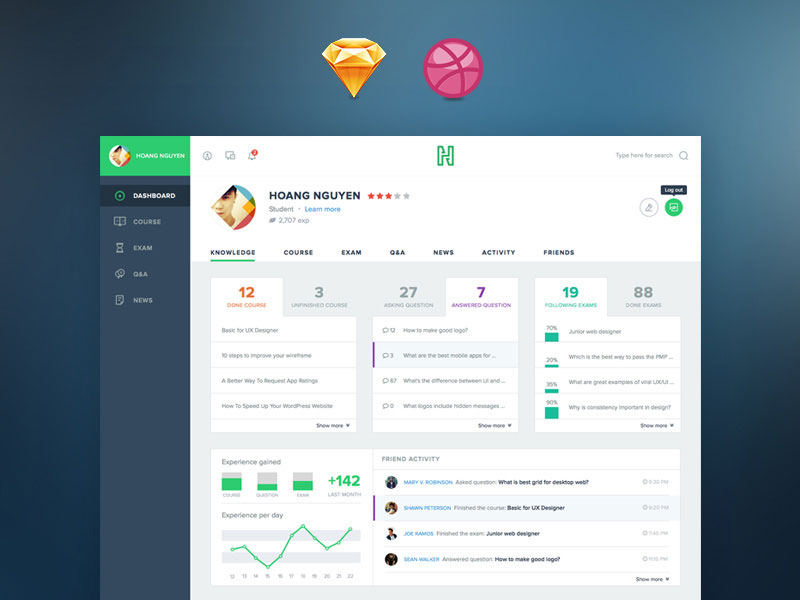
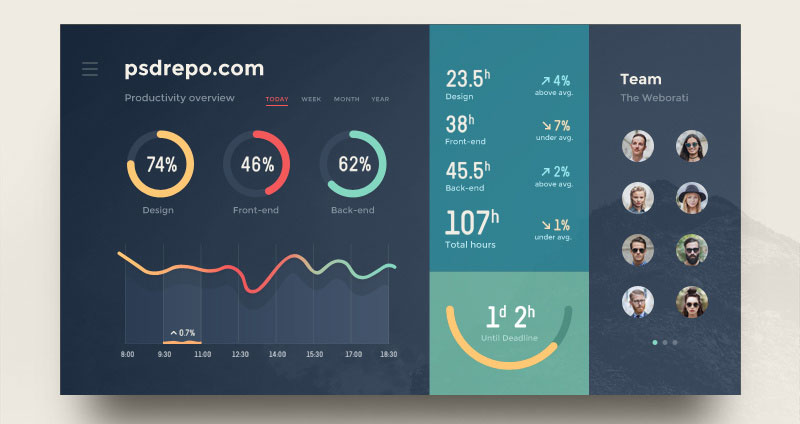
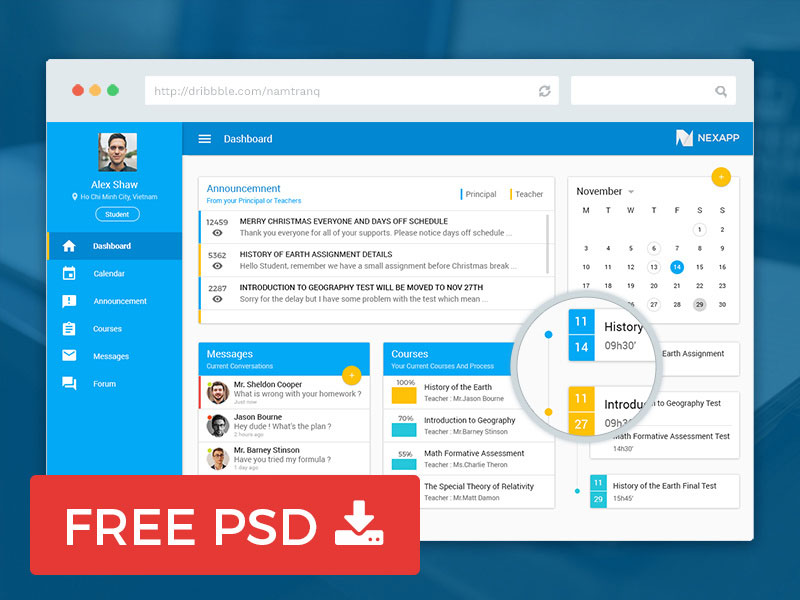
Dashboard
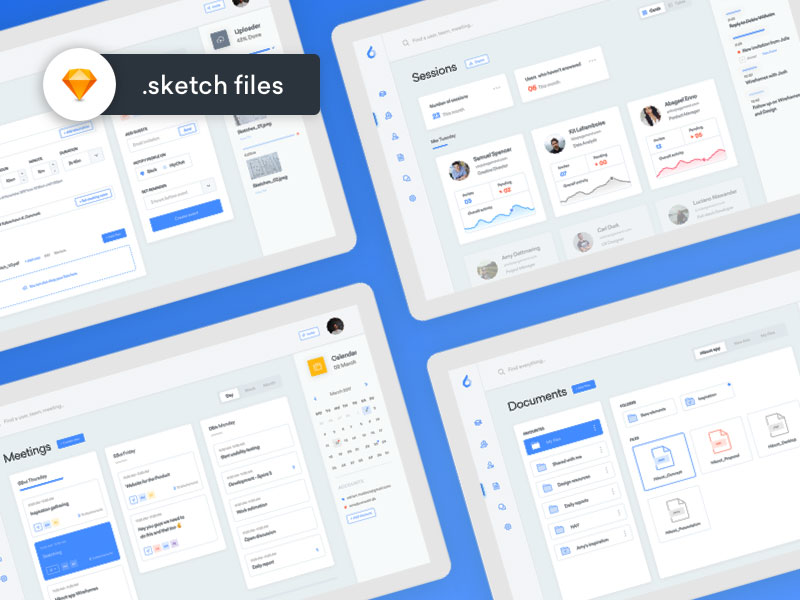
Dashboard by Sketch 3
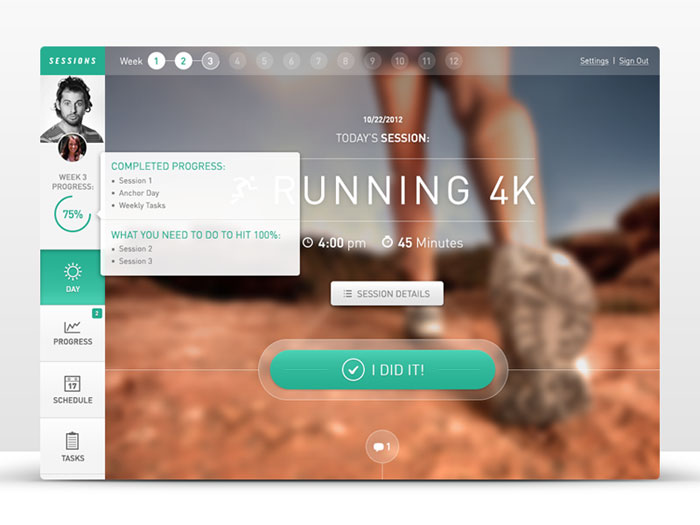
Fitness Web App: Sessions
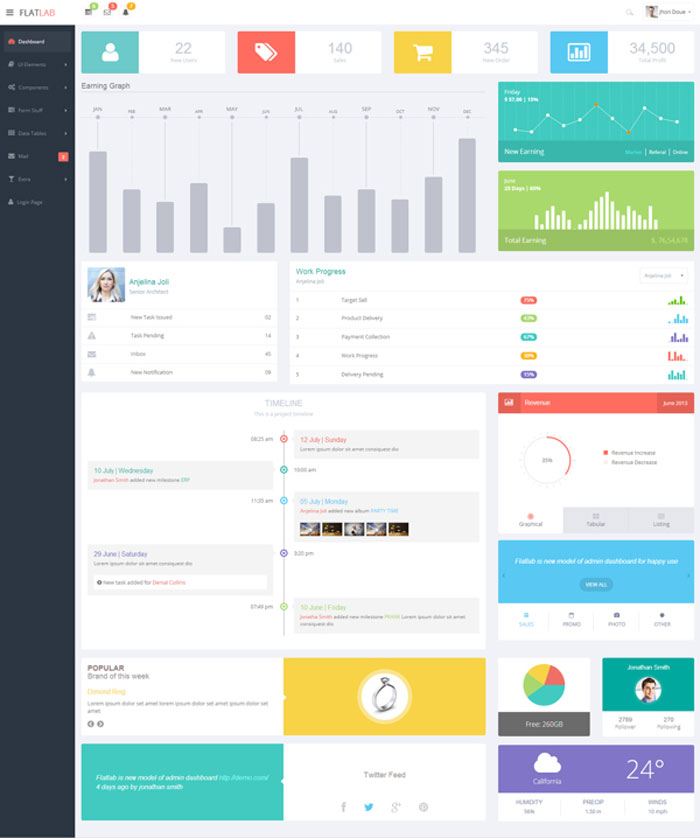
FlatLab – Flat & Responsive Admin Template

Website Analytics Dashboard

Dashboard Web App UI: Job Summary

Desk.com Dashboard design
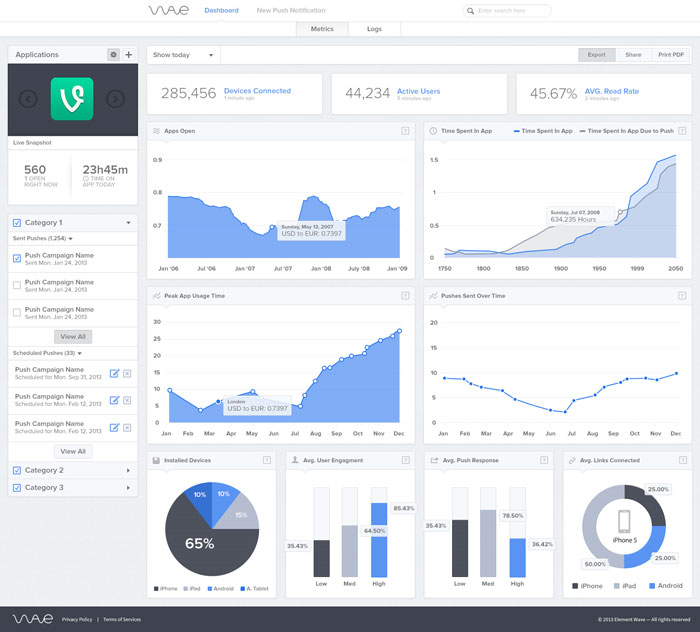
Element Wave Dashboard Update

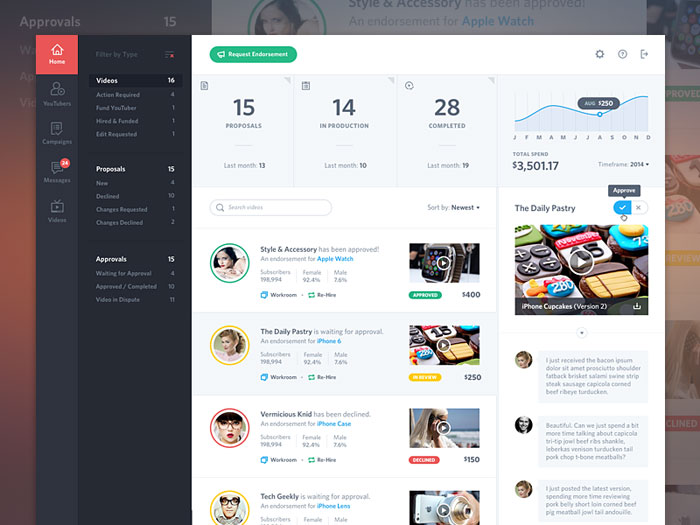
I love Dashboards
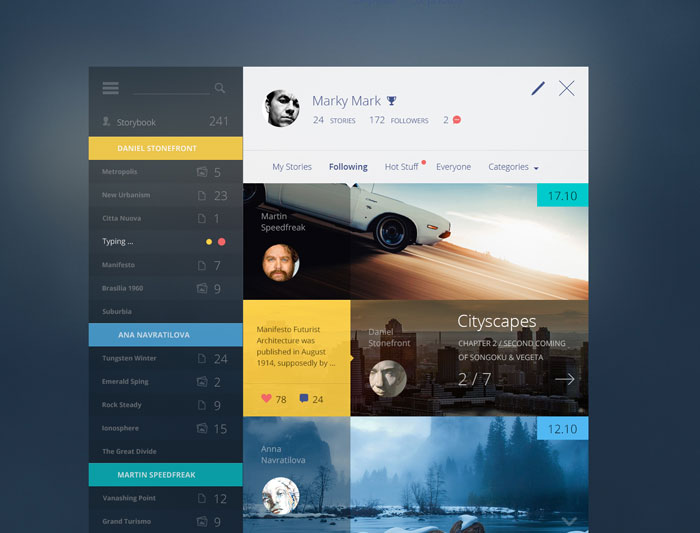
Story Book

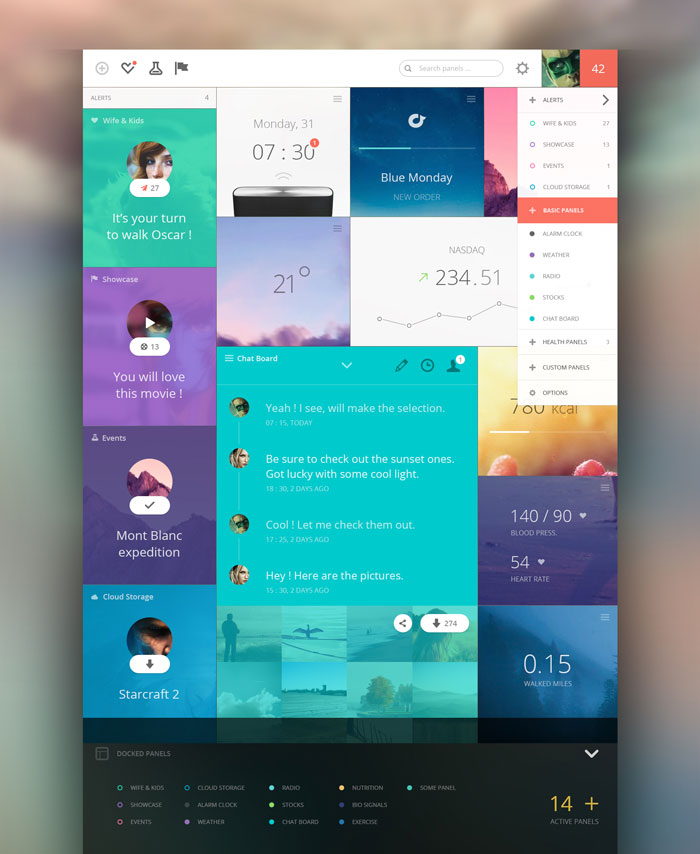
Panels Dashboard design

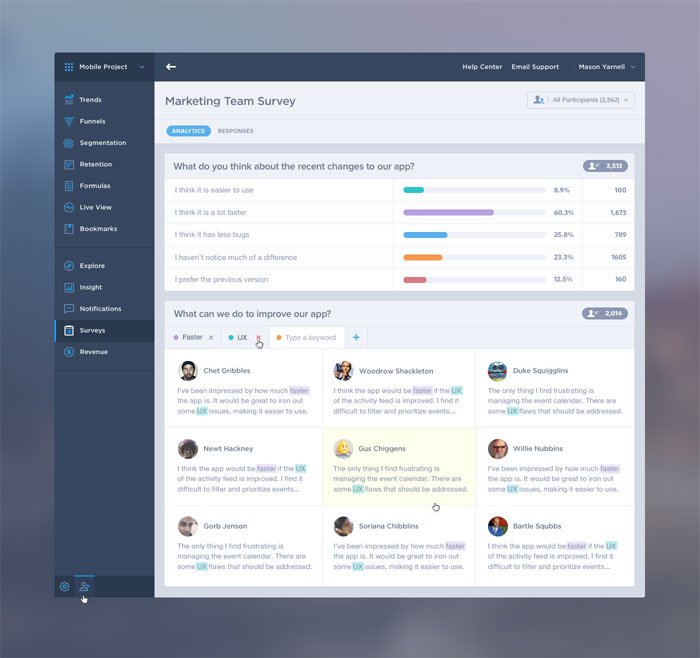
Mixpanel Survey Analytics UI/UX

Home Statistics Dashboard design

MB Dashboard
To-Do Dashboard

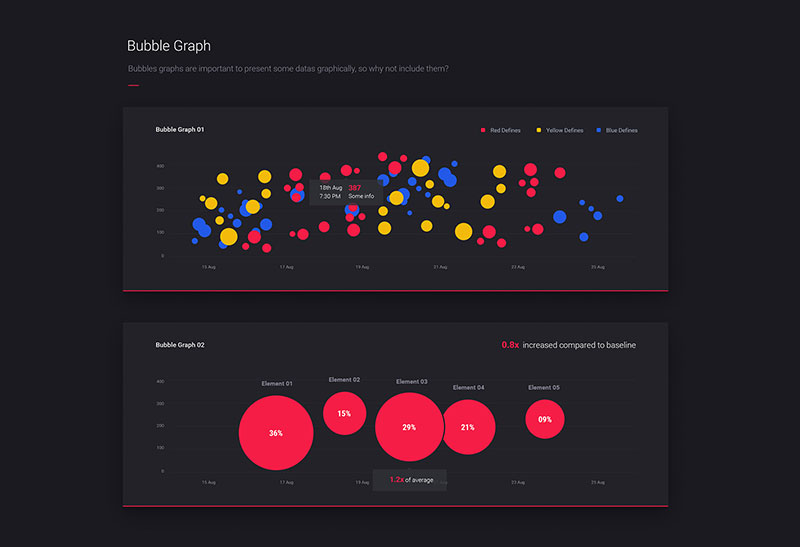
Some Analytics

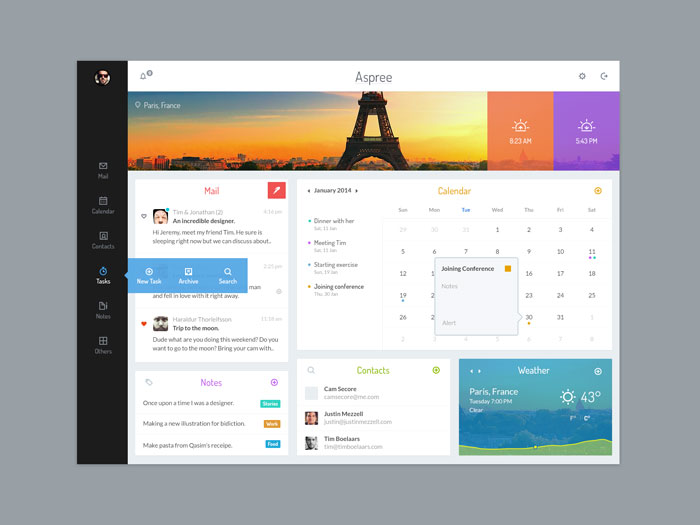
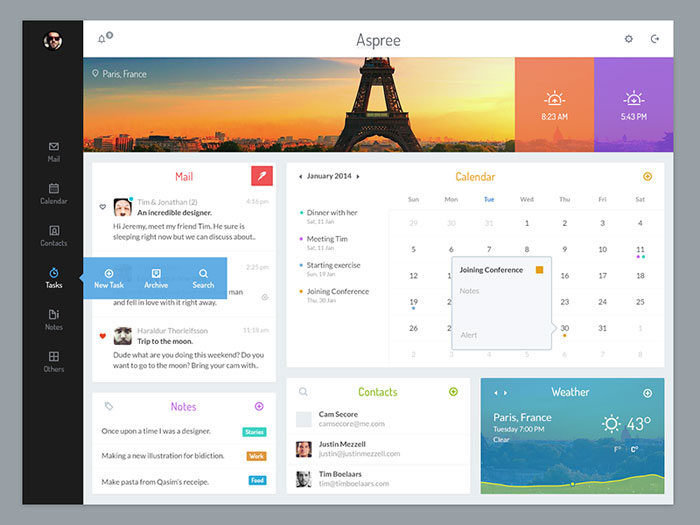
Aspree
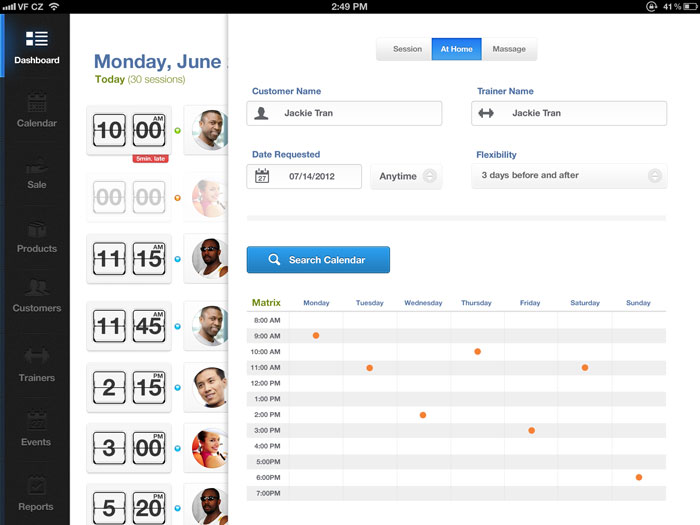
iPad UI Design
Dashboard Full 2

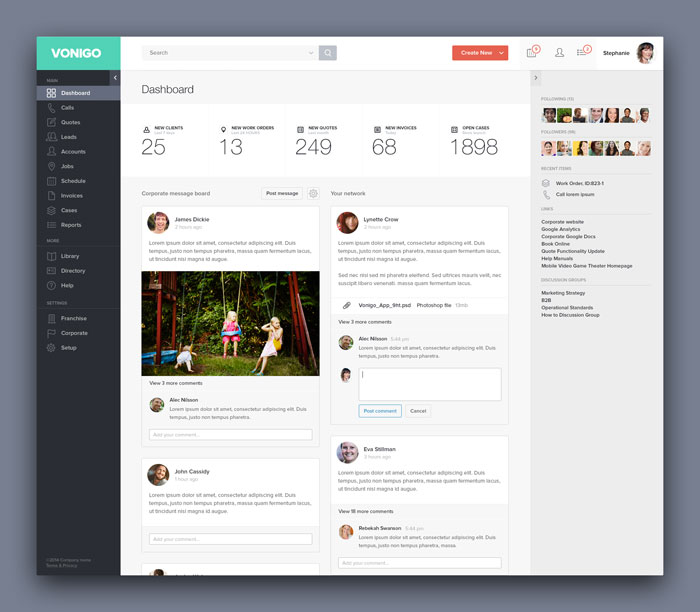
Vonigo – Dashboard

Accent Dash II

Dashboard WordPress
Flat Dashboard

Webapp Dashboard

Rolodex Dashboard
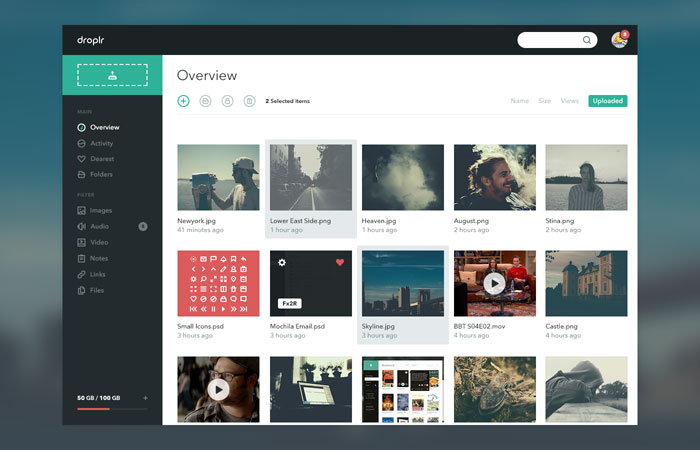
Droplr Dashboard

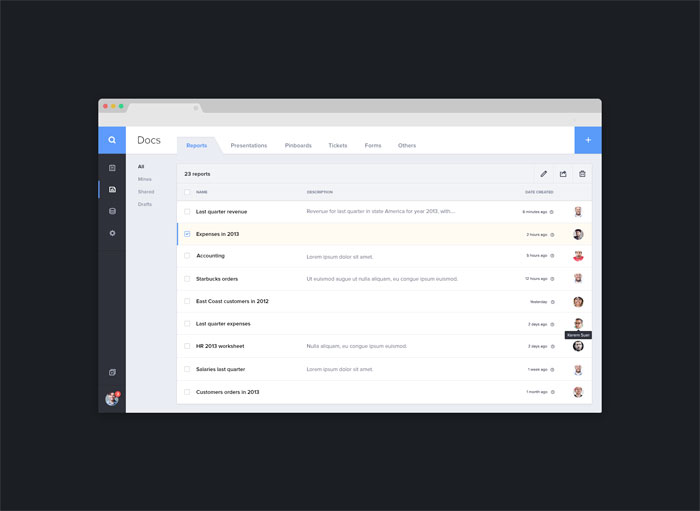
Dashboard

Health Analytics Dashboard Preview
A dashboard design
Panels Dashboard

Task Management App
Dashboard UI Stats

Product Dashboard design, Activity Feed UI/UX
To-Do Dashboard design

Story Book

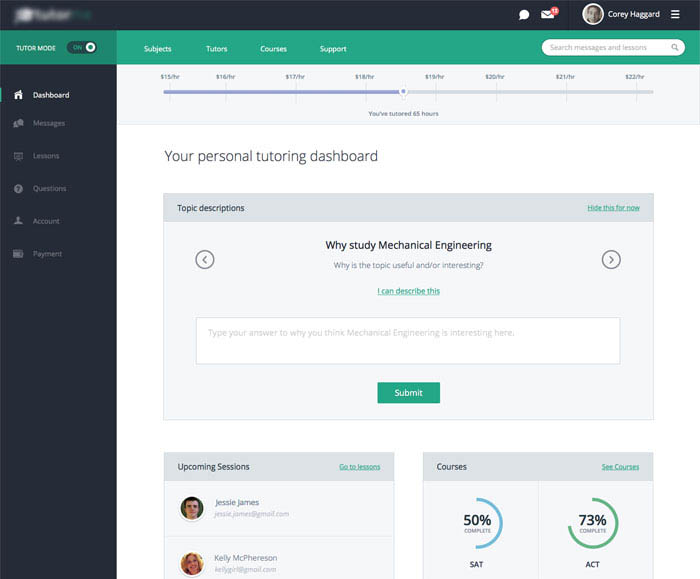
Tutor App UI

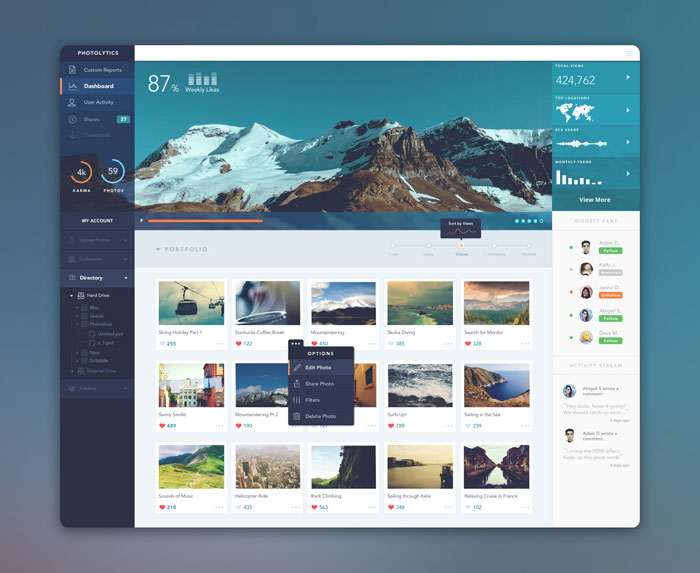
PhotoLytics Dashboard UI

Dashboard
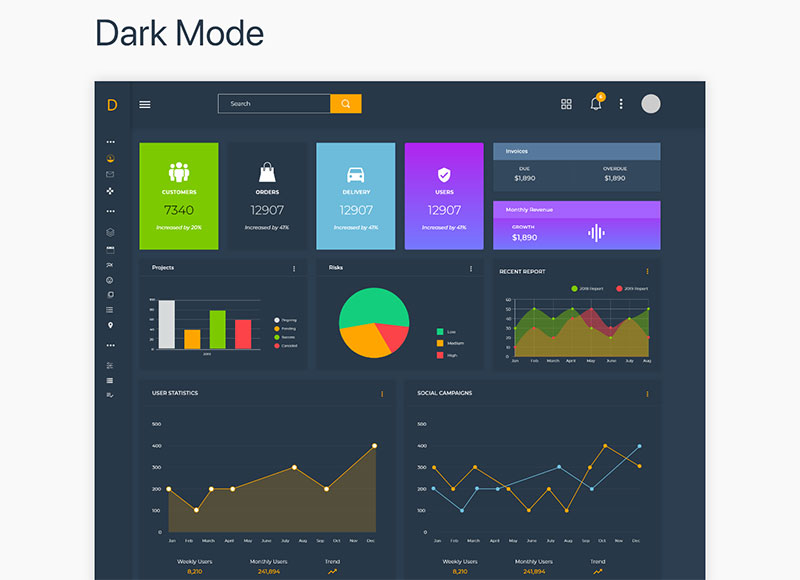
Dark Analytics Dashboard design
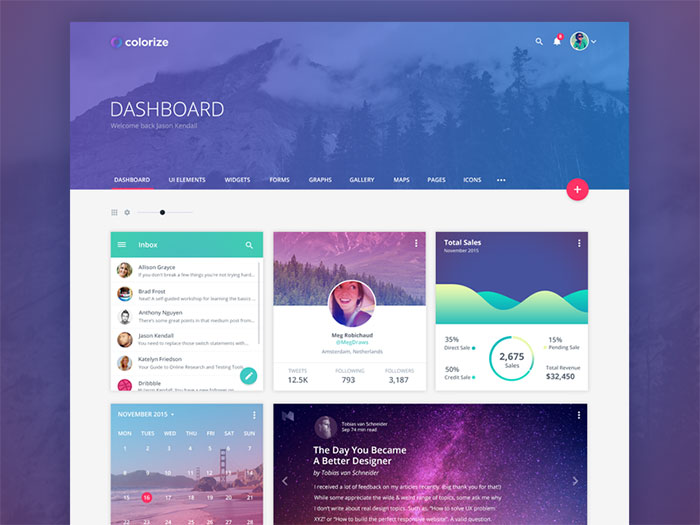
Xonom

Health app

Pastel Projects

Aspree
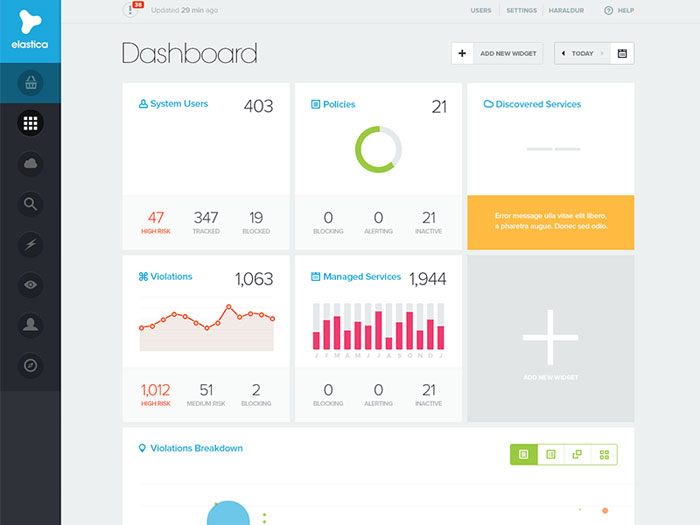
Elastica – Dashboard
Accent Dash II

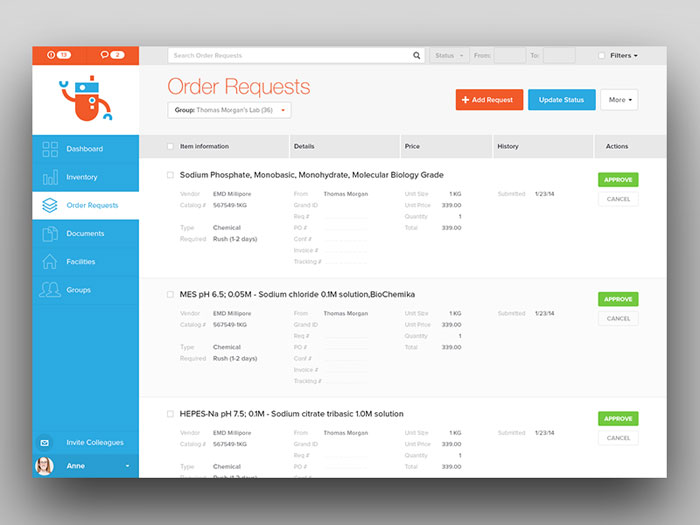
Quartzy – Order Requests
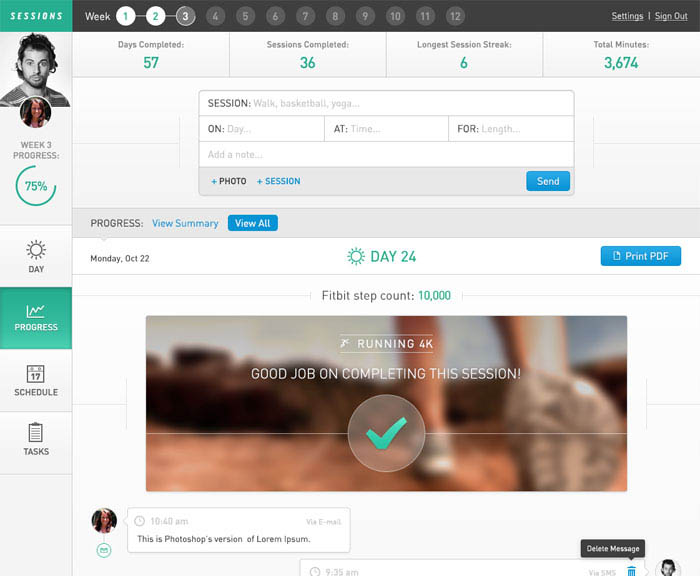
Progress View

Movie App Final
I love Dashboards
How To Design And Code An Admin Dashboard? Like These Examples
Designing a mobile dashboard can challenge you a little bit due tot the fact that you have to put only the absolutely essential elements in there. Space isn’t unlimited on a mobile device screen and you must be aware of that.
On the web, however, things aren’t like that. There is a lot of space, but this doesn’t mean that you must put stats for absolutely everything. You still have to constrain yourself a little bit, but you get the big advantage of having a big wide screen where to put your dashboard elements.
What I like the most about designing dashboards for websites and web apps is that you can make responsive web design your advantage and can display multiple fields above the fold on big monitors.
Now check out the following dashboards and look at how they were designed and coded. This might give you an idea of how you should do the next dashboard task that is sent to you by your clients.
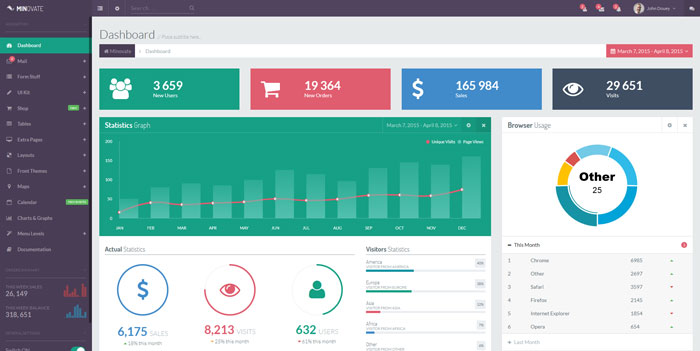
Minovate

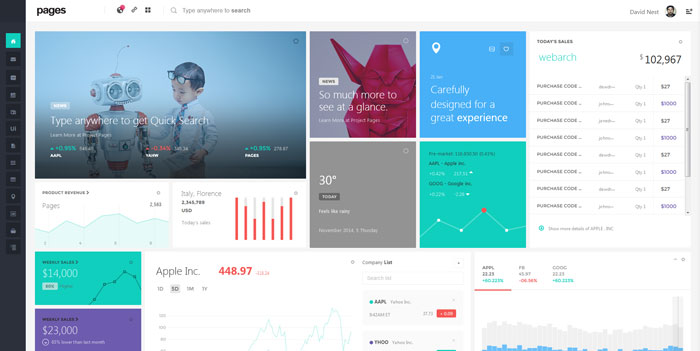
Pages
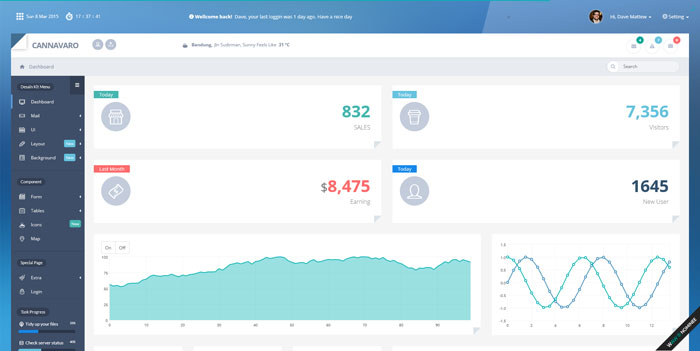
Cannavaro
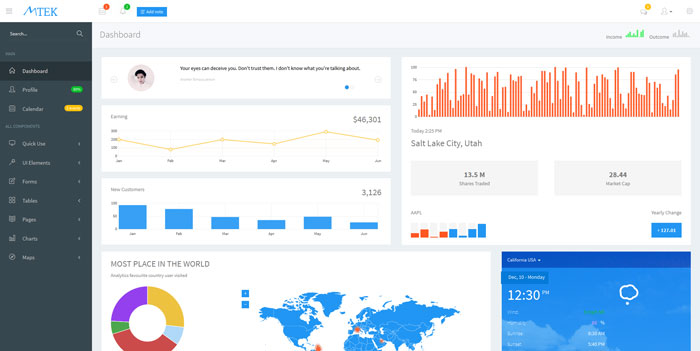
Mtek
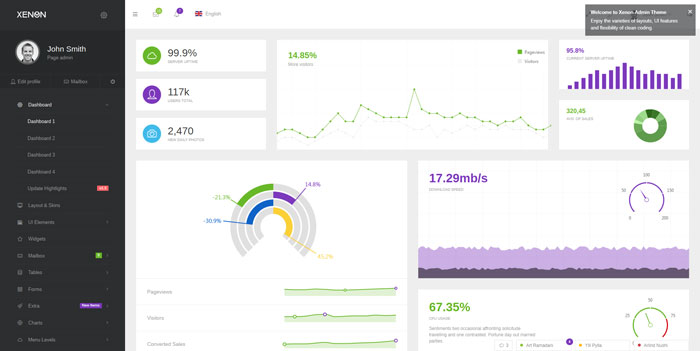
Xenon
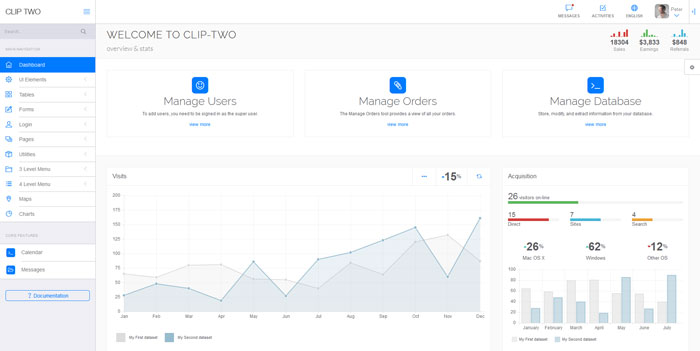
Clip-two
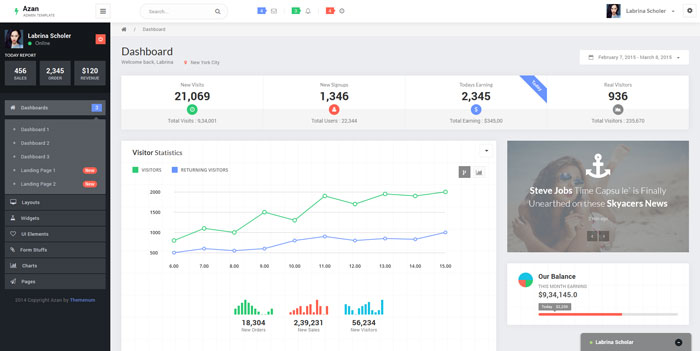
Azan
Pleasure
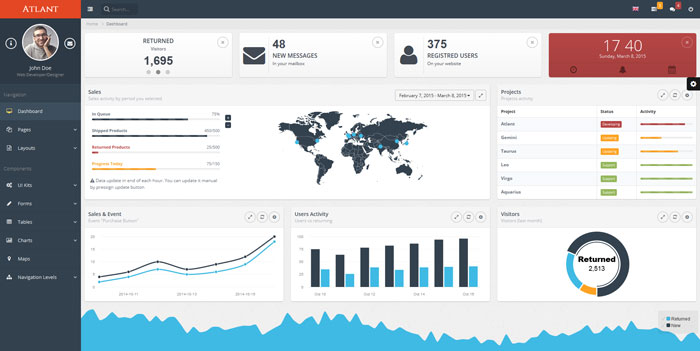
Atlant
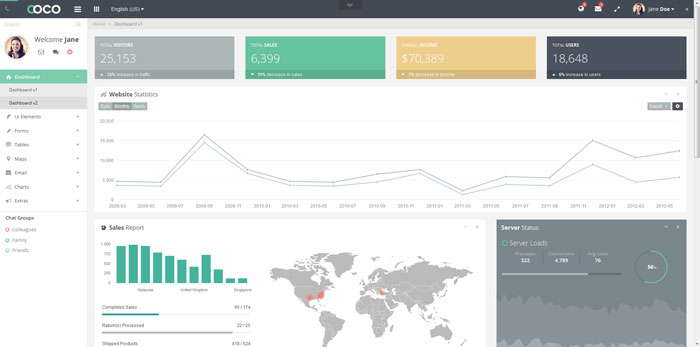
Coco

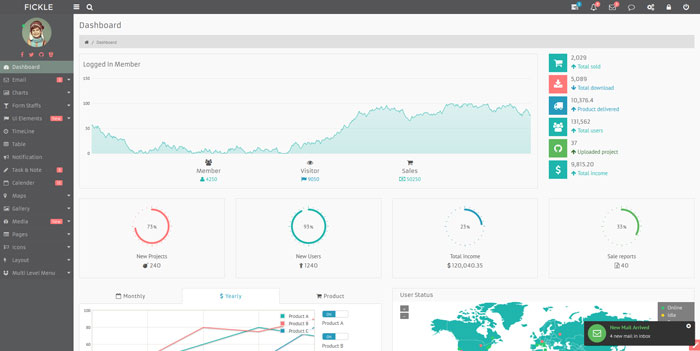
Fickle
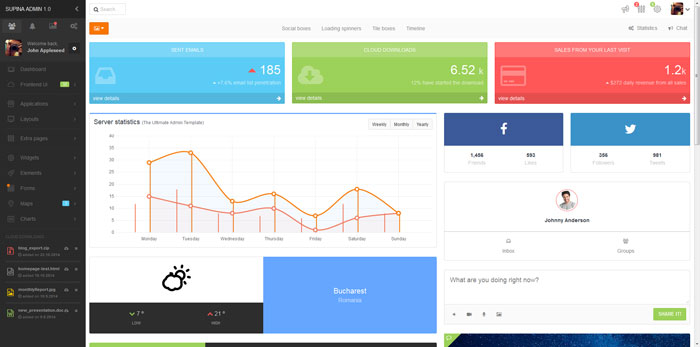
Supina
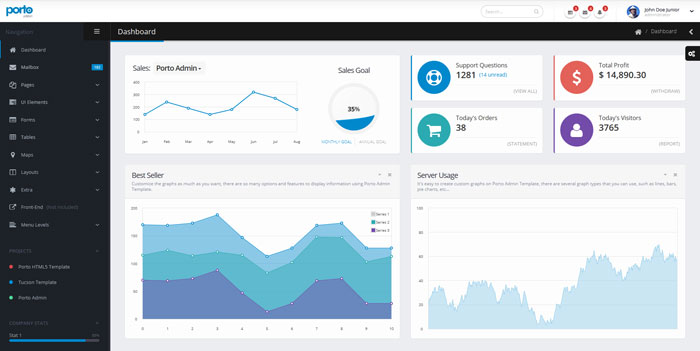
Porto
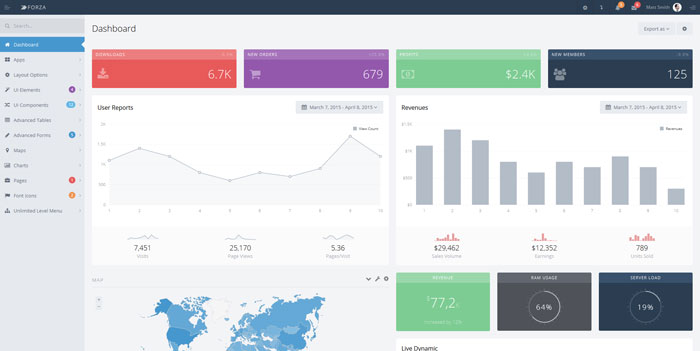
Forza
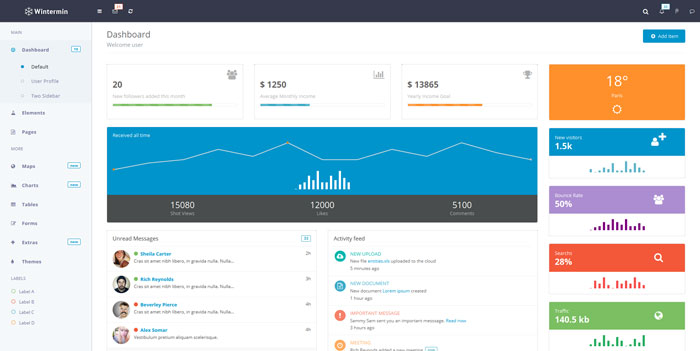
Wintermin
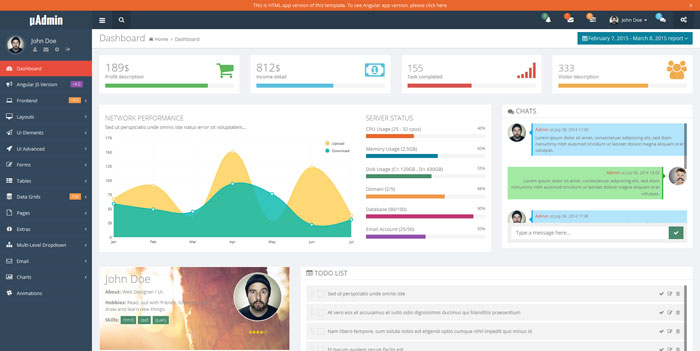
uAdmin
Dashboard UI kits and templates
Web Dashboard UI Kit
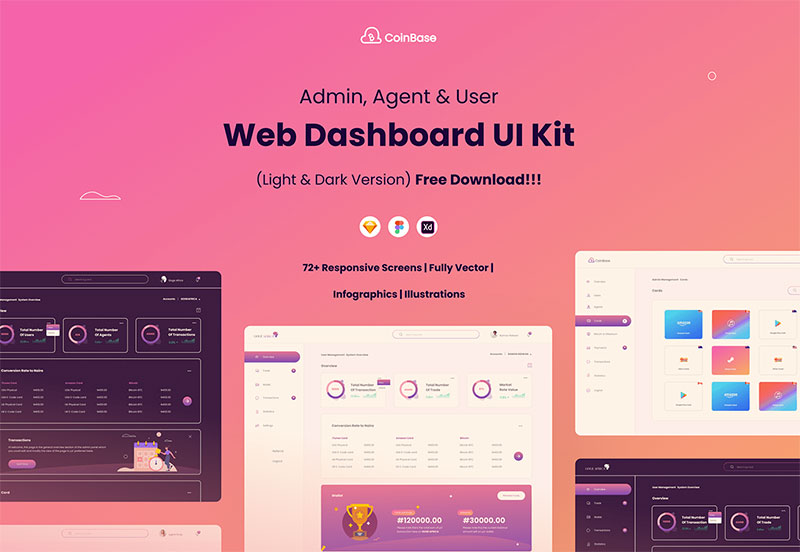

This dashboard UI kit is available for Figma, and it is one of the more modern kits on this list. Download it now and try it out.
Velocity Dashboard UI kit
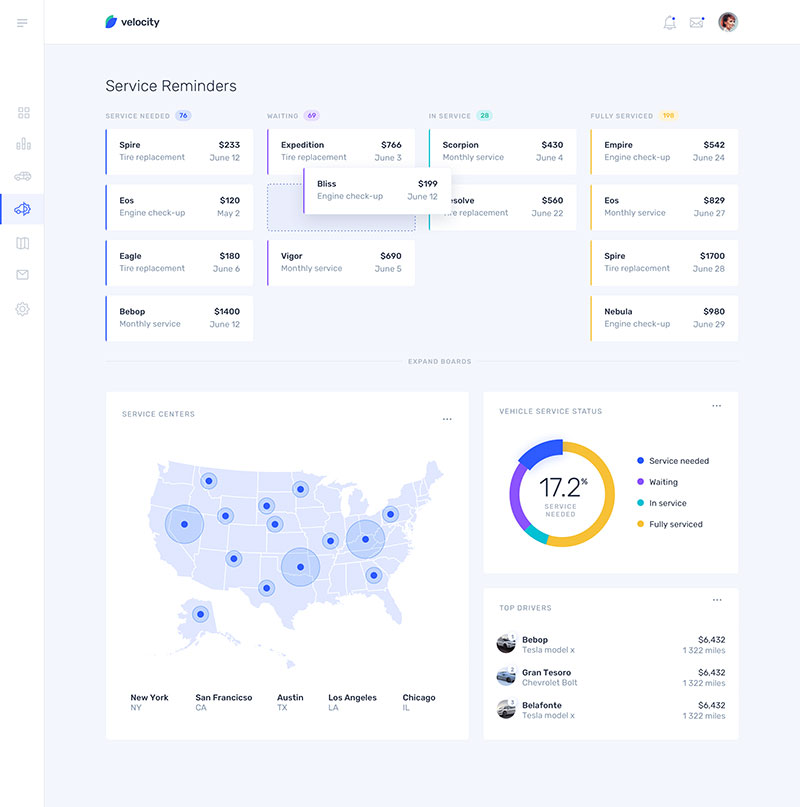

If you are looking for a dashboard that is to the point and lets you manage your things easily, then this one is for you. There are more than 300 UI elements in this kit, and 70 components and 30 screens. But worry not, the numbers are not an indicator of the quality; instead, they present a nice myriad of options in a clean interface.
VMware Dashboard Exploration
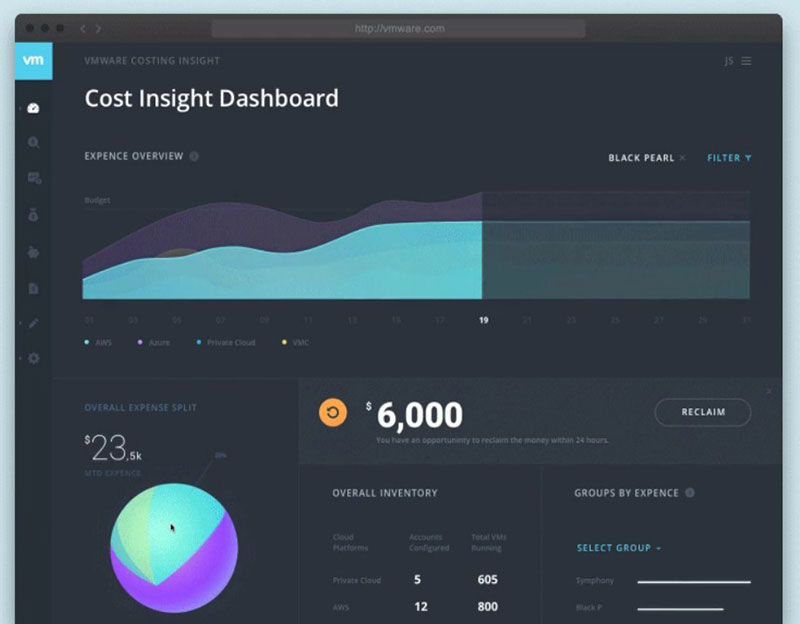

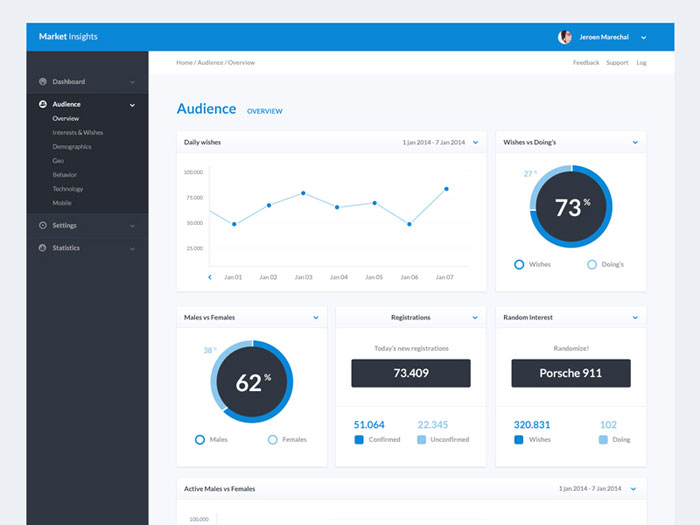
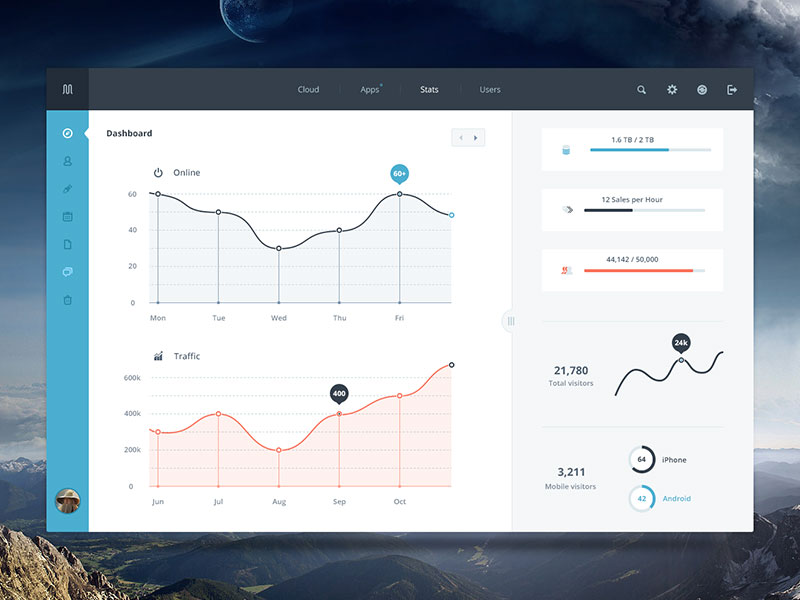
Presenting charts has never been easier and more intuitive than with the VMware Dashboard exploration. Data visualization is more and more important nowadays, and it is very well made with this kit. You can simply click any piece of information that interests you, such as pie and line charts, and see it in a matter of moments.
Smart Home UI kit by Invision
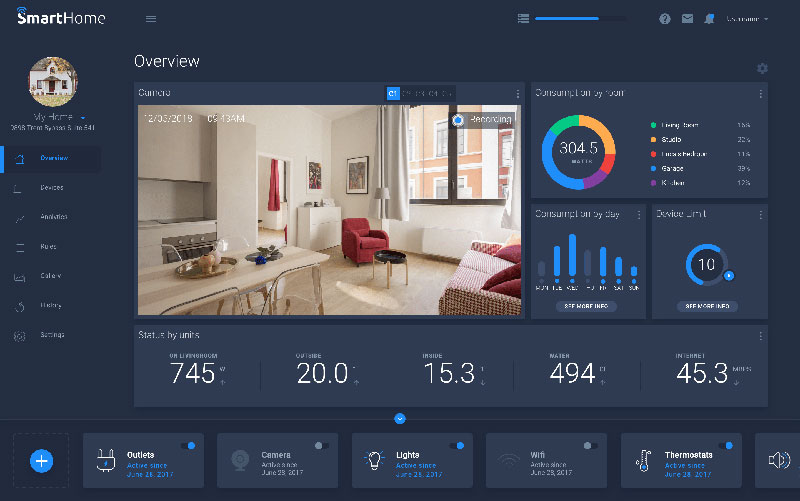

This dashboard UI kit is primarily made for devices and designs that are included under the “smart home” umbrella. Although, it does have some very interesting features such as the line bar chart which makes it useful for other purposes, too. There are 100+ UI elements, and 24 screens to choose from.
Cryptocurrency Dashboard
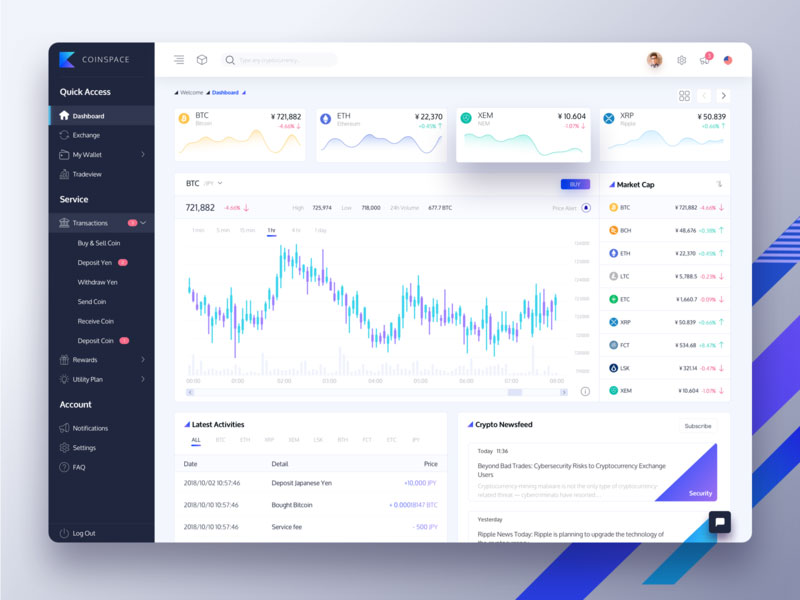

This cryptocurrency dashboard will let you manage your portfolio of cryptocurrencies with some amazing and lightweight dashboard elements. These include cards, breadcrumbs, data tables, line charts, and many more useful elements.
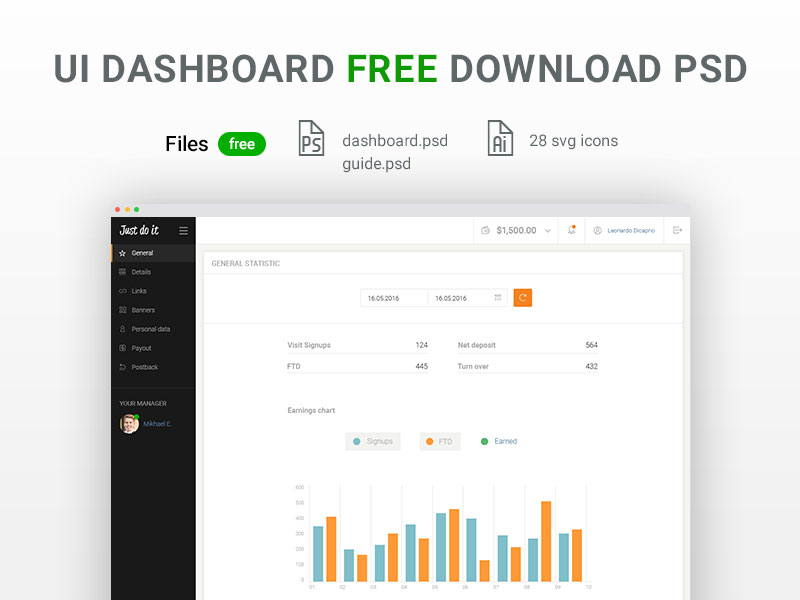
Free Dashboard UI Kit

Excellent organization, good UI design, and 28 SVG icons, plus 2 files for download (guidelines and ready-made dashboard). What more can you ask from a free dashboard UI kit?
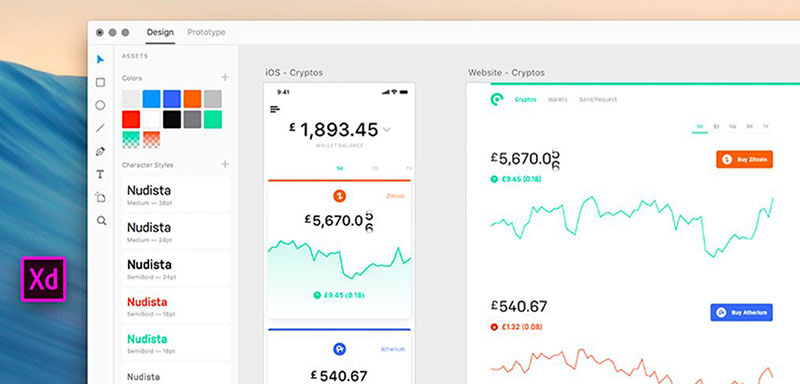
Adobe XD Dashboard UI Kit
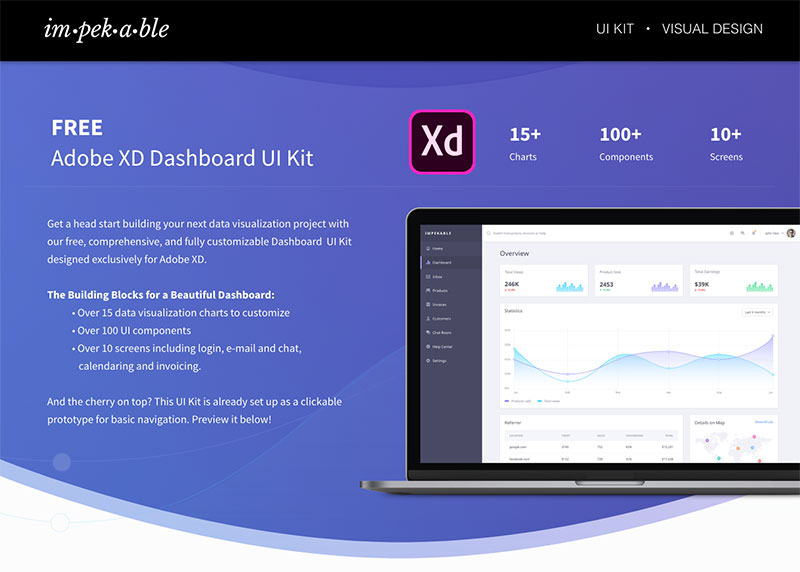

This free dashboard UI kit is a very good tool to use for the best possible data visualization. The reason this kit is so good is that it offers many customization options, as well as a wide array of tools.
With this UI kit, the data visualization can be a doddle. There are 15 data visualization charts included, as well as 100+ UI components. You will get data range pickers, call to actions, and various other tools. And remember, this one is completely free.
BuvudeCommerce Dashboard UI/UX Kit
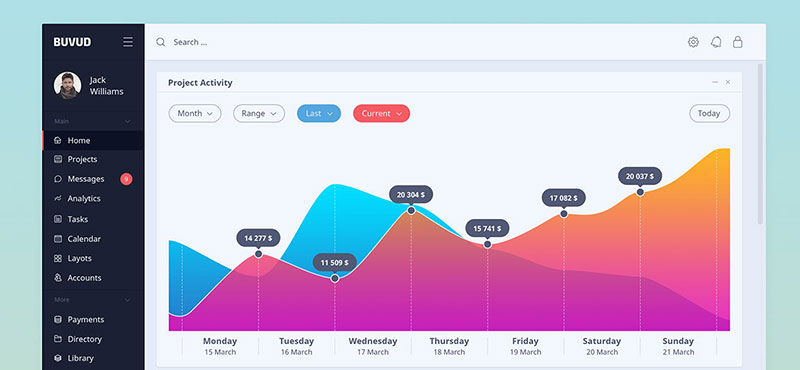

Download this dashboard UI kit for eCommerce data management and visualization.
Fliminc
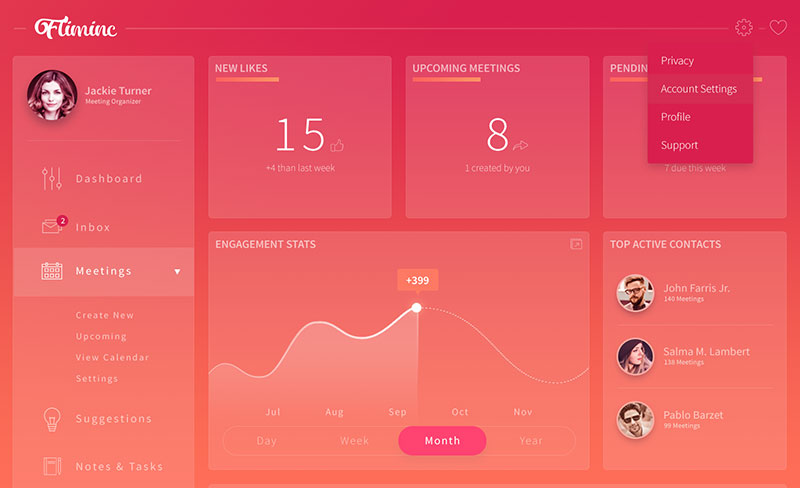

This one is also free, and it is primarily made for Adobe Photoshop. It allows you to use it for both personal and commercial projects. It is a modern-looking dashboard, and it presents a good option especially for beginners as a starting point.
Free Adobe XD Dashboard UI kit
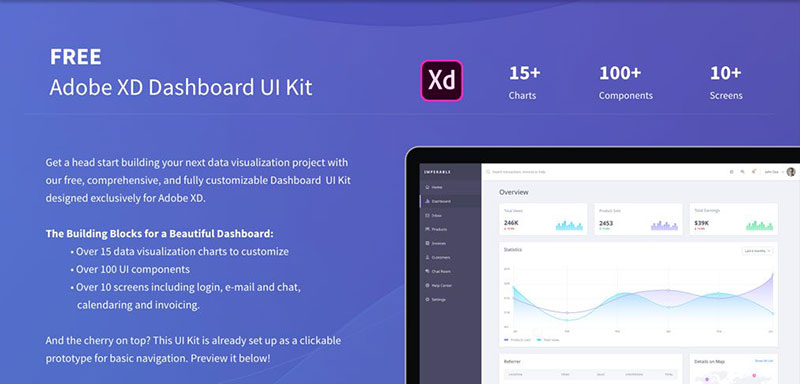

Another completely free dashboard UI kit that allows you to fully customize your dashboard and all the elements. There are 15 data visualization charts, and 100+ UI components.
Freebie: Course Dashboard (Sketch)
Foxy Free Admin Panel and Dashboard UI Kit
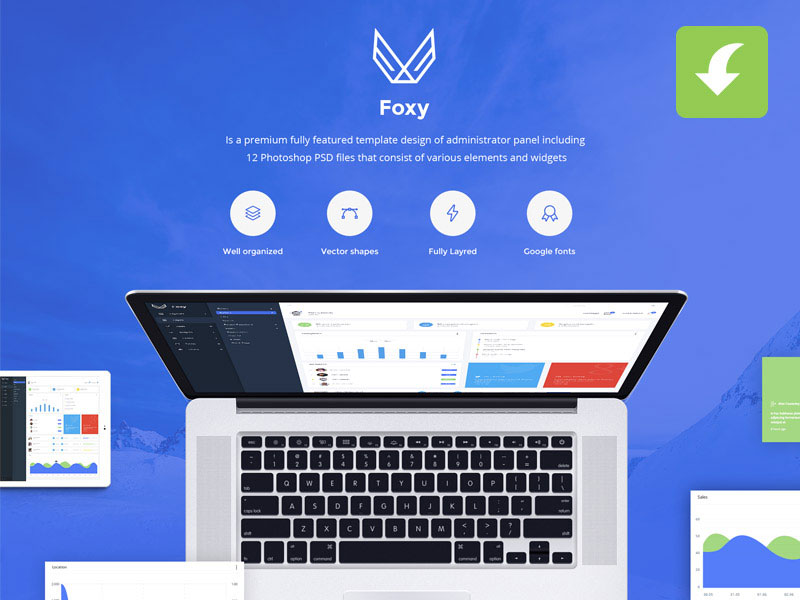
This template is made primarily for administration purposes. Admins will be glad to know that this UI kit offers a lot for everyday use, and can make work much easier. This kit is rich of useful elements and features, and there are elements divided into various categories: blogs, articles, calendars, buttons, charts, gallery, and more. 3 menu types are also included: standard, standard with icons, and pull-down menu.
Dashboard design with XD file

Responsive Dashboard Design
Download and use this responsive dashboard design for a great experience.
Free Dashboard UI Kit
Cooin
This is a free UI kit that was designed for use on web browsers as well as for IOS. There are many useful features included that allow easy trading and management of cryptocurrencies. These features include buying and selling digital currencies, viewing currency values, personal wallets, and sending and requesting cryptocurrencies. All in all, this kit offers everything and more for cryptocurrencies, and you should also consider the fact that it is free.
Free Stat Dashboard Sketch Template

This UI template is very good for creating statistics and reports. It is free to download as well.
Smart Admin Dashboard UI

Grapic – Free Dashboard UI PSD
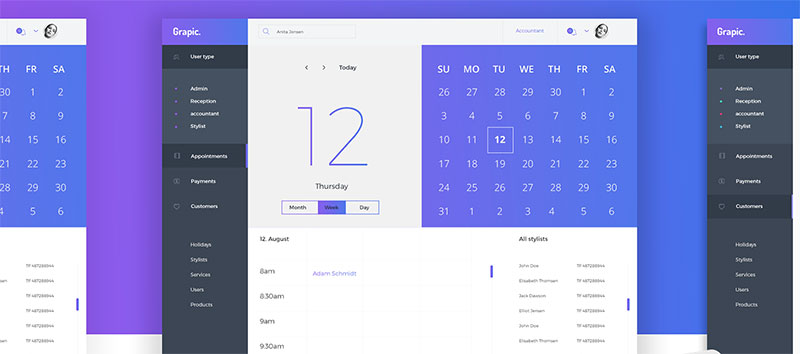

Minimalism is the name of the game with this dashboard UI kit. You will get a nice-looking calendar, along with a sidebar that you can use with various colors.
Datta Dashboard UI Kit – Free Sample for Sketch and Adobe XD

This kit has a useful set of features, and is viable both for Sketch and Adobe XD. You can download it and use it free of charge.
Dashboard UI Kit

If you are looking for a good dashboard UI kit for Strategy Dashboards, then this kit is the one for you. The best thing about it is that it contains forms and charts, as well as models.
Productivity Dashboards
Increase your day-to-day productivity with everyday tasks with these templates.
Carsive Dashboard UI Kit

This huge bundle of features contains just about everything that you need for creating pages that are orientated towards statistics. The default background color is black, and it uses other colors to display stats and charts very visibly.
Freebie PSD
This one is one of the most popular and free kits for both personal and commercial purposes. The kit includes basic widgets and other important elements that can help you create good dashboards.
Modern Dashboard

This modern and clean dashboard kit offers everything that it takes to create an intuitive and modern dashboard. It is a PSD template that allows you to build dashboards for your account. There are useful daily elements, including the weather widget, and many more.
Just do it
While this is a relatively small package, it contains everything necessary to create useful designs. There are still some very good individual, smaller elements that you can take advantage of.
Dione
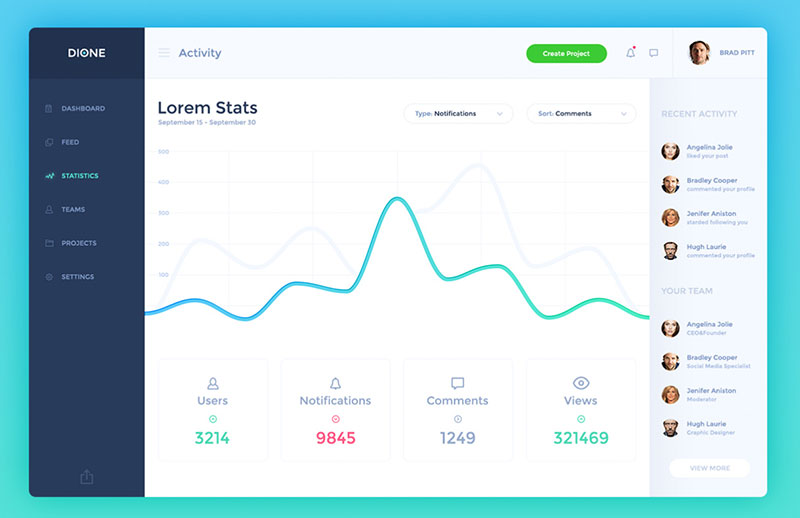

A free kit that can be used for both commercial and personal projects, no attributions needed.
Summer Kit
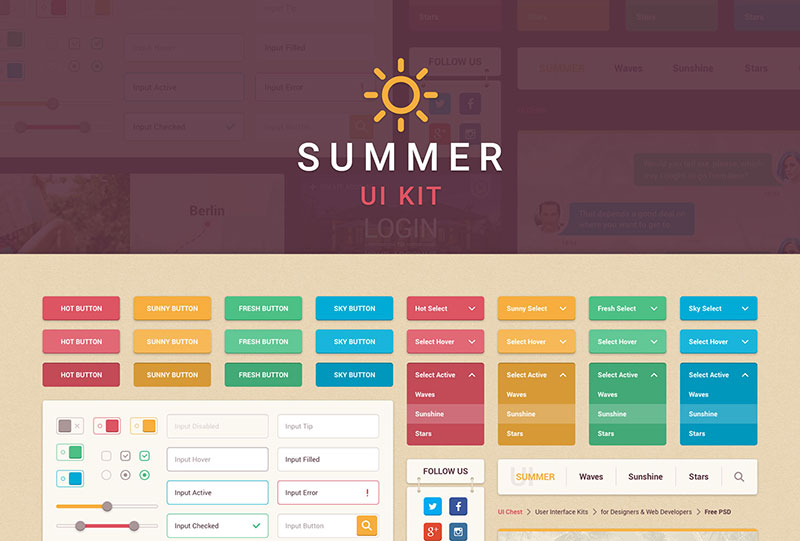

The beauty of the Summer kit is that it contains all the elements needed for both Sketch and Photoshop in one set. You can create a stunning design that will appeal to many people, and there are also a plethora of useful elements included.
Free PSD Dashboard
Another free dashboard kit with top and left navigation bars.
Chat minimal UI kit
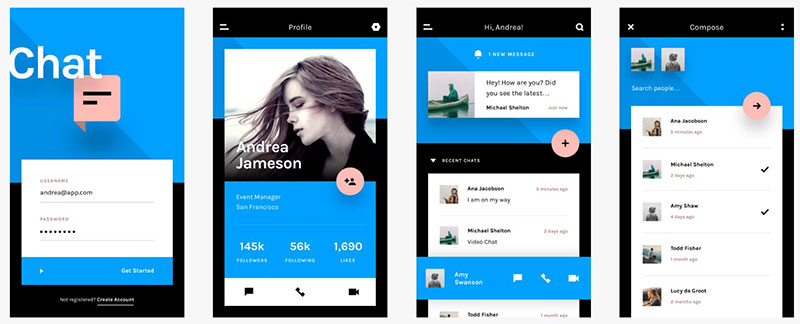

60 design templates, 12 categories, and more than 80 UI components. It is a cross-platform Invision UI kit.
Admin DashBoard
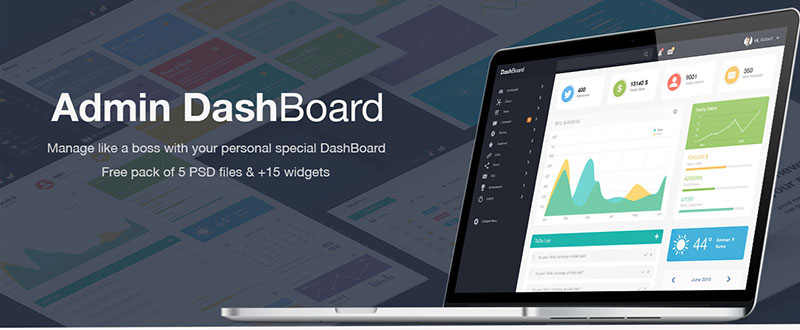

Best used for admin purposes, this kit contains all the essentials.
Admin Dashboard UI

Free Education Dashboard
It can be used for educational purposes, as it contains messages, calendars, and more useful features.
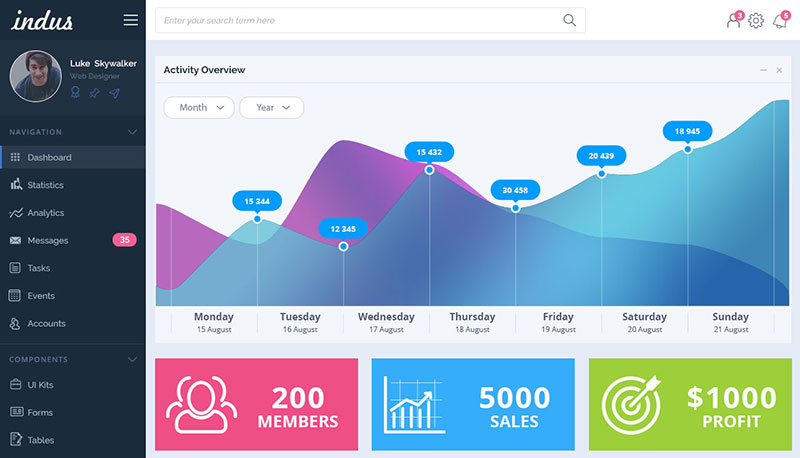
Indus

This multi-purpose kit offers just about everything that one needs.
Sales Dashboard
Designed primarily for sales, you can download this kit now to get access to its many useful features.
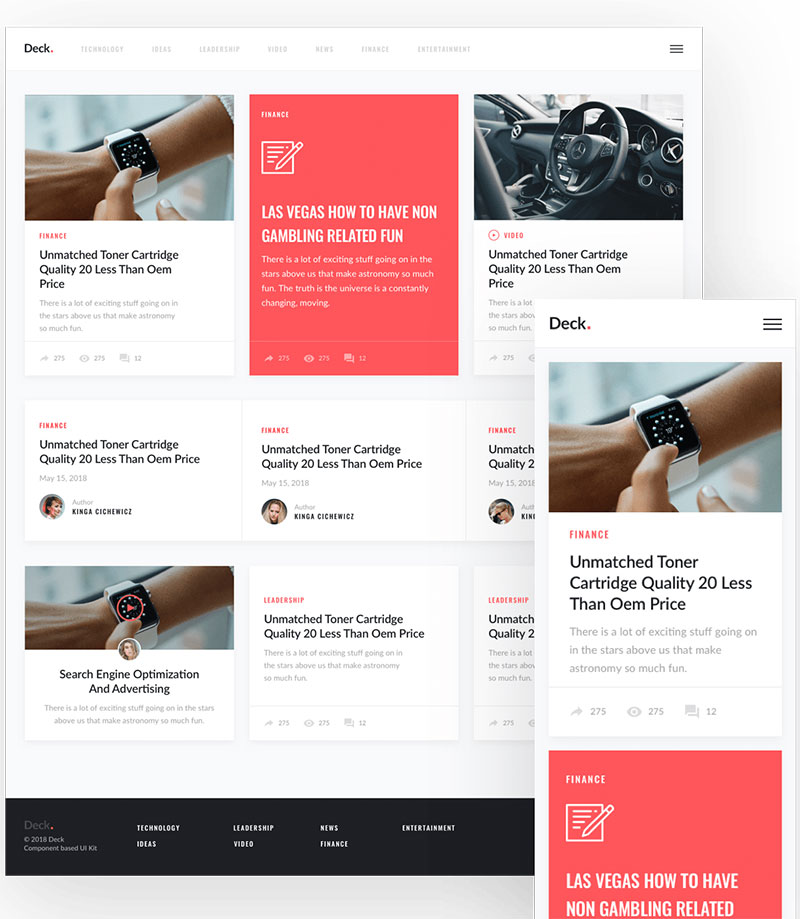
Deck card-style UI kit

Dashboard UI Kit Elements
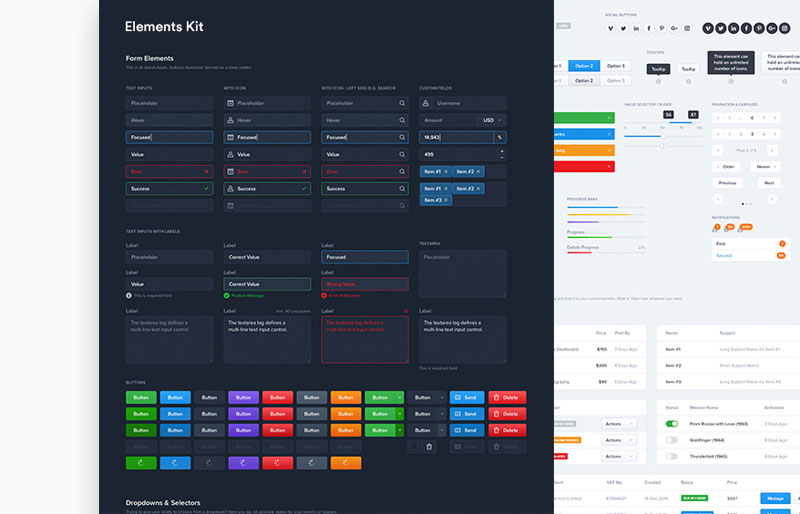

For a kit as packed with UI elements as this, it is surprising that it is free.
Wofsus Dashboard [Freebie]
Multi-purpose free kit.
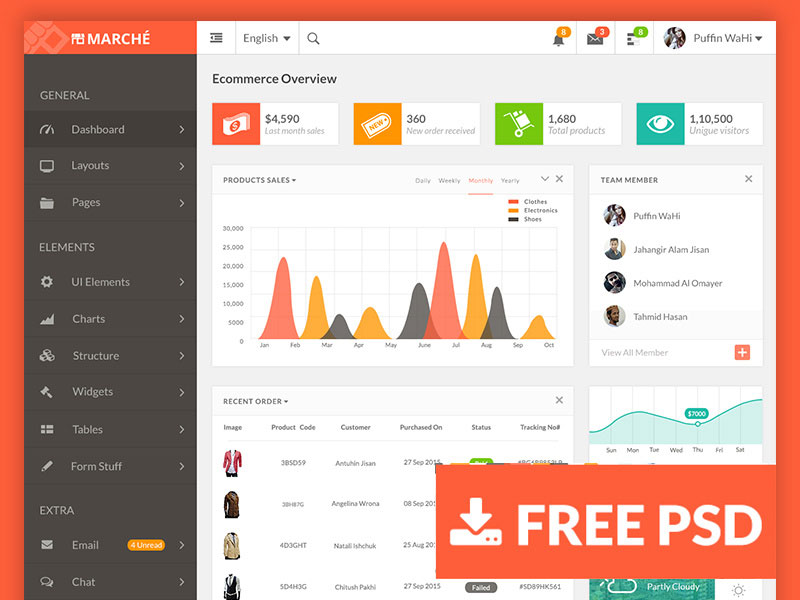
Marche Dashboard (Freebie)
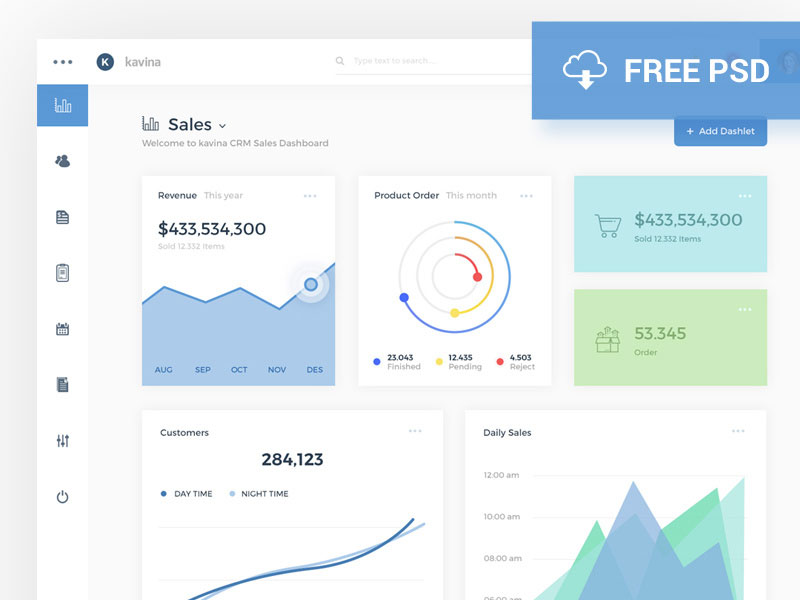
Kavina Dashboard Analytics Light Version
FAQ on dashboard UI design
What is a dashboard UI design?
A dashboard UI design, in a nutshell, is the visual layout and organization of elements in a dashboard interface.
It’s meant to present users with important data, metrics, and information in a clear, concise, and visually appealing manner. A well-designed dashboard allows users to monitor performance, analyze trends, and make informed decisions quickly and efficiently.
The key is to strike a balance between aesthetics and functionality to create an enjoyable and productive user experience.
Why are dashboards important in UI design?
Dashboards play a vital role in UI design because they provide users with a central hub to access and interact with critical data.
They can save time and effort by presenting an overview of key performance indicators (KPIs), trends, and other relevant information. A well-designed dashboard facilitates decision-making, helps users track progress, and can even encourage engagement with the application. In short, a good dashboard UI design can significantly enhance the overall user experience.
How can I create an effective dashboard UI design?
Creating an effective dashboard UI design involves understanding your users’ needs and preferences. Start by identifying the essential data points and KPIs that users require.
Next, organize the information using a clean and intuitive layout. Focus on visual hierarchy, ensuring the most important elements are prominent. Use charts, graphs, and other visual aids to present data in an easily digestible format. And finally, ensure your design is responsive and accessible across various devices and screen sizes.
What are some best practices for dashboard UI design?
Here are some best practices to keep in mind when designing a dashboard UI:
- Keep it simple: Avoid clutter and prioritize clarity. Stick to a clean layout with sufficient white space.
- Visual hierarchy: Ensure the most important data points are prominent and easy to locate.
- Consistency: Use a consistent design language, including colors, fonts, and icons, to create a cohesive experience.
- Responsive design: Ensure your dashboard works well on different devices and screen sizes.
- Use visuals: Leverage charts, graphs, and other visual aids to make data more accessible.
- Customization: Allow users to personalize their dashboard to suit their needs and preferences.
What are common types of visualizations for dashboard UI design?
There’s a variety of visualizations you can use in dashboard UI design, depending on the data being presented. Some common types include:
- Bar charts: Great for comparing values across categories.
- Line charts: Ideal for displaying trends over time.
- Pie charts: Useful for showing proportions or percentages.
- Gauges and progress bars: Perfect for illustrating progress towards a goal or target.
- Heatmaps: Excellent for visualizing patterns or concentrations in data.
Choose the right visualization to effectively communicate the information at hand.
How important is interactivity in dashboard UI design?
Interactivity is a crucial aspect of dashboard UI design. By allowing users to interact with the data presented, you can enable them to explore, analyze, and gain deeper insights.
Interactive features like filters, tooltips, and drill-down options can significantly improve the user experience. Moreover, it fosters engagement and keeps users coming back to the dashboard for more information. So, investing in interactivity is definitely worth the effort!
How can I make my dashboard UI design accessible?
Creating an accessible dashboard UI design means ensuring it can be used by people with varying abilities and needs. Here are some tips:
- Use high-contrast colors for improved readability.
- Include descriptive text and labels for charts and visualizations.
- Provide keyboard navigation and shortcuts for users who can’t use a mouse.
- Ensure your design is compatible with screen readers and other assistive technologies.
- Offer options to adjust font size, color, and other display settings.
By prioritizing accessibility in your dashboard UI design, you’re creating a more inclusive and user-friendly experience for everyone.
This not only benefits users with disabilities but also improves usability for people using different devices, screen sizes, or even those working in low-light environments.
Accessible design also demonstrates your commitment to providing equal access to information and can even help your product comply with legal requirements. Ultimately, prioritizing accessibility is a win-win situation for both users and your business.
What tools can I use to create dashboard UI designs?
There are many tools available to help you create dashboard UI designs. Some popular options include:
- Sketch: A vector-based design tool for Mac users, offering a range of plugins and integrations to streamline your workflow.
- Figma: A browser-based design tool that supports real-time collaboration, making it perfect for teams.
- Adobe XD: A versatile design tool from Adobe, which integrates well with other Creative Cloud applications.
- InVision Studio: A powerful design and prototyping tool with features like responsive design and advanced animations.
Choose a tool that fits your needs, budget, and preferences, and start designing your dashboard UI.
How can I test the usability of my dashboard UI design?
Testing the usability of your dashboard UI design is essential to ensure it meets the needs and expectations of your users. Some approaches you can use include:
- User testing: Conduct usability tests with real users to gather feedback and identify areas for improvement.
- A/B testing: Compare different design variations to determine which performs better in terms of usability and user satisfaction.
- Heuristic evaluation: Use established usability principles to systematically evaluate your dashboard UI design and identify potential issues.
- Analytics: Monitor user behavior and engagement metrics to gain insights into how people interact with your dashboard and identify areas for optimization.
By incorporating usability testing into your design process, you can create a more effective and user-friendly dashboard UI.
Ending thoughts on dashboard UI design
We’ve reached the end of this fantastic adventure through the realm of dashboard UI design. I must say, I’ve had an absolute blast sharing this experience with you.
- So, let’s quickly recap some highlights from our journey, shall we?
- We discovered the importance of simplicity and clarity when creating those dashboards.
- We played with colors and typography to make sure everything is legible and visually appealing.
- You know what else? We learned that a well-designed dashboard can make all the difference for users, helping them access crucial information more efficiently.
Now, I’d like to leave you with a few parting thoughts:
- Keep experimenting and refining your designs. You never know when you’ll stumble upon the perfect solution.
- Stay up to date on the latest design trends and best practices. It’s always good to be in the know.
- And, most importantly, have fun with it! After all, designing dashboard UIs is a creative process, so let your imagination run wild.
So there you have it, folks. I hope our time together has left you inspired and ready to tackle your next dashboard UI design project.
If you enjoyed reading this article about dashboard UI kits, you should read these as well:
- The best Adobe XD UI kits (free and premium)
- Axure tutorials for beginners to quickly learn to use the app
- Facebook mockup templates you can quickly download and use